Figure 6.
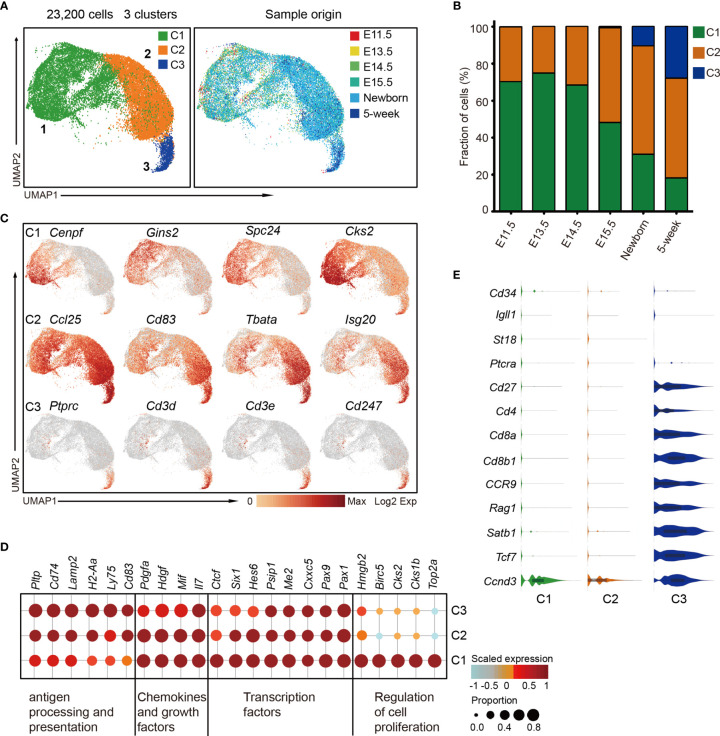
The temporal dynamics of cTEC diversity during development. (A) UMAP visualization of 23,200 cTECs with 3 subclusters. (B) Percentages of 3 cTEC subtypes across the development. (C) UMAP visualization of the expression of curated feature genes specific for 3 cTEC subtypes. (D) Dot plot for expression of marker genes in 3 major cTEC subtypes. Color represented maximum-normalized mean expression of marker genes in each cell group, and size indicated the proportion of cells expressing marker genes. (See also Figure S6A .) (E) Violin plots showing the smoothened expression distribution of selected genes specific for T-cell differentiation in cTEC subtypes.

