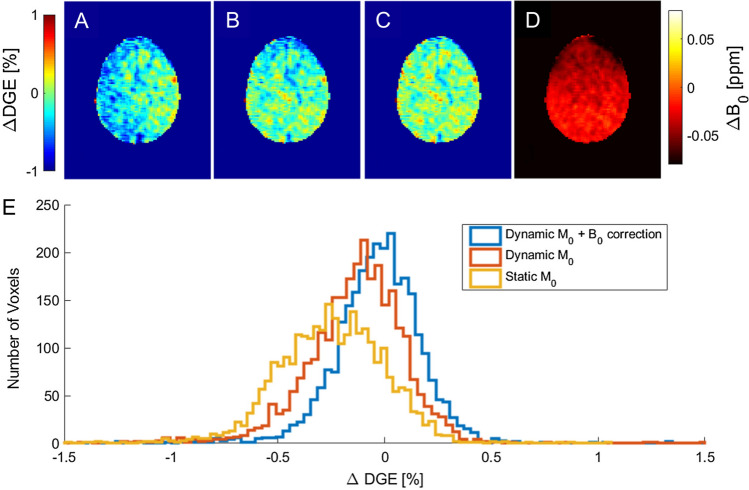
Fig. 10.
Effect of motion correction, interleaved M0, and dynamic B0 correction. A ∆DGEρ [%] map of a volunteer measurement (image number 16 at ∆ω = 0.9 ppm) after motion correction. Here, the entire left hemisphere seems to be affected by a strong hypointensity. B ∆DGEρ map with a normalization to the corresponding image at − 300 ppm. Here, the image is more flat, but still shows slight correlation with B0 (D), especially in the anterior part. C ∆DGEρ map with the same normalization as (B) and an additional B0 correction as proposed in Windschuh et al. [68]. The dynamic B0 correction normalizes the anterior part that is hypointense in (B). D ∆B0 map [ppm] relative to the beginning of the measurement. E Histogram for the images in (A–C). From [22], with permission

