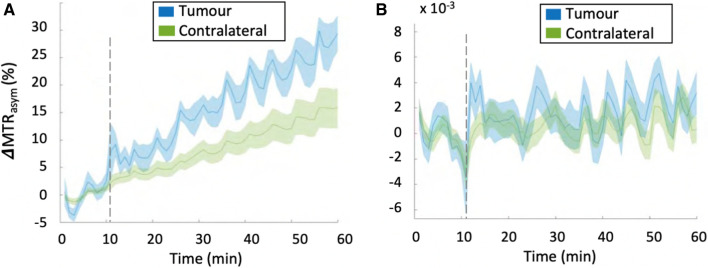
Fig. 11.
A MTRasym signal integrated in the range of 2—3 ppm before B0 and B1 correction shows field drifts both in tumor and contralateral regions of a patient with prostate cancer. It is worthwhile to note that the changes due to B0 drift are much larger in the body, due to the increased drift observed. In this case the B0 drifts across slice and entire scan duration were found to be 25 Hz (0.2 ppm) and 200 Hz (1.56 ppm), respectively. B After B0 correction, no significant enhancement in MTRasym signal is observed and the signal intensity is significantly reduced. From [25], with permission

