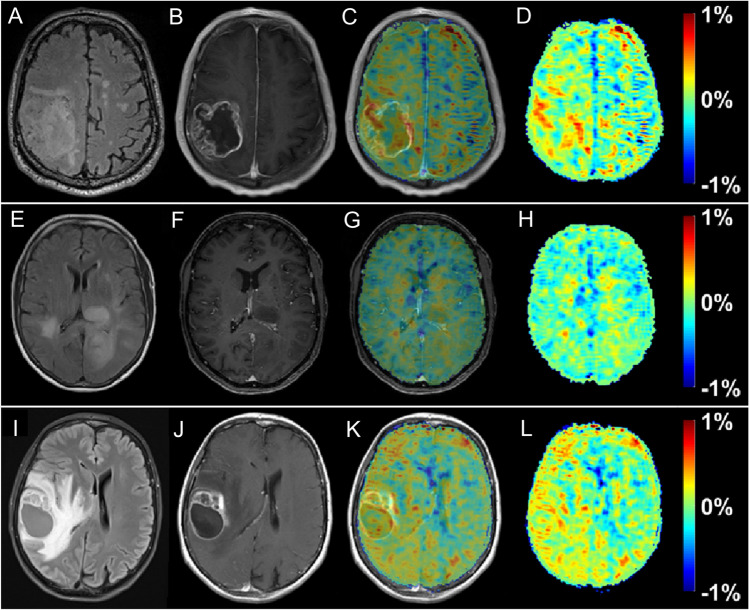
Fig. 12.
T2 FLAIR (A, E, I), T1‐ce (B,F,J), T1‐ce with overlaid ∆DGEρ map (C, G, K), and the ∆DGEρ‐maps (D,H,L) of patient 1 (A–D, ~ 7 min post-injection), 2 (E–H, ~ 7 min post-injection), and 3 (I–L, ~ 9 min post-injection). From [22], with permission

