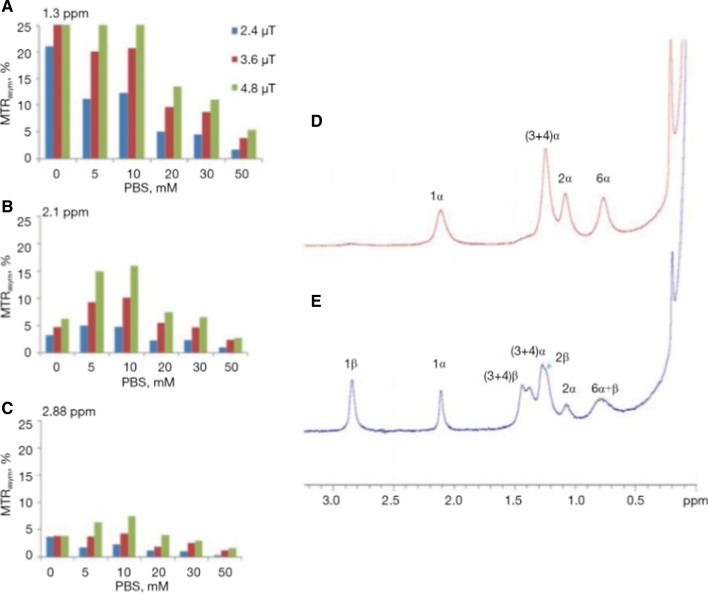
Fig. 4.
Bar graph showing % of MTRasym of 20 mM glucose solution (10% D2O) at several PBS concentrations at the typical frequency offsets of the hydroxyl peaks (A) 1.3 ppm, (B) 2.1 ppm and (C) 2.88 ppm from the water peak (T = 37 °C, 11.7 T). 1H NMR spectra of the hydroxyl protons of 0.1 M D-Glc solution (T = 4 °C, pH = 5.4, 11.7 T). Spectra were recorded on a fresh sample (D) and several hours after the sample preparation (E). From [44], with permission

