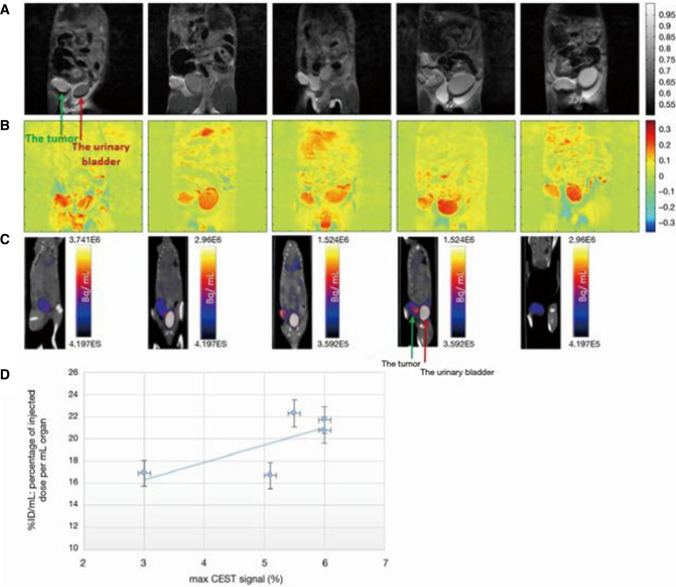
Fig. 5.
3OMG-based DGE MRI and 18F-FDG-PET/CT images from five tumors of a murine model (4T1 cells). A A coronal view of an anatomical T2-weighted MR images (7 T field) before 3OMG administration showing the tumor (green arrow) and the urinary bladder (red arrow). B % CEST images 60 min after per os administration with 3OMG, 1.0 g/kg (at a frequency offset of 1.2 ppm, B1 = 2.4 µT). A significant CEST contrast was obtained in the tumor and the urinary bladder as well as areas suspected to be metastases. C 18F-FDG-PET/CT coronal view obtained 60 min after IV injection of 18FDG showing accumulation mainly in the tumor (green arrow) and urinary bladder (red arrow). D Correlation between 3OMG % CEST contrast and % ID/mL value in the five tumors from a murine model ± S.D [44]. From [44], with permission

