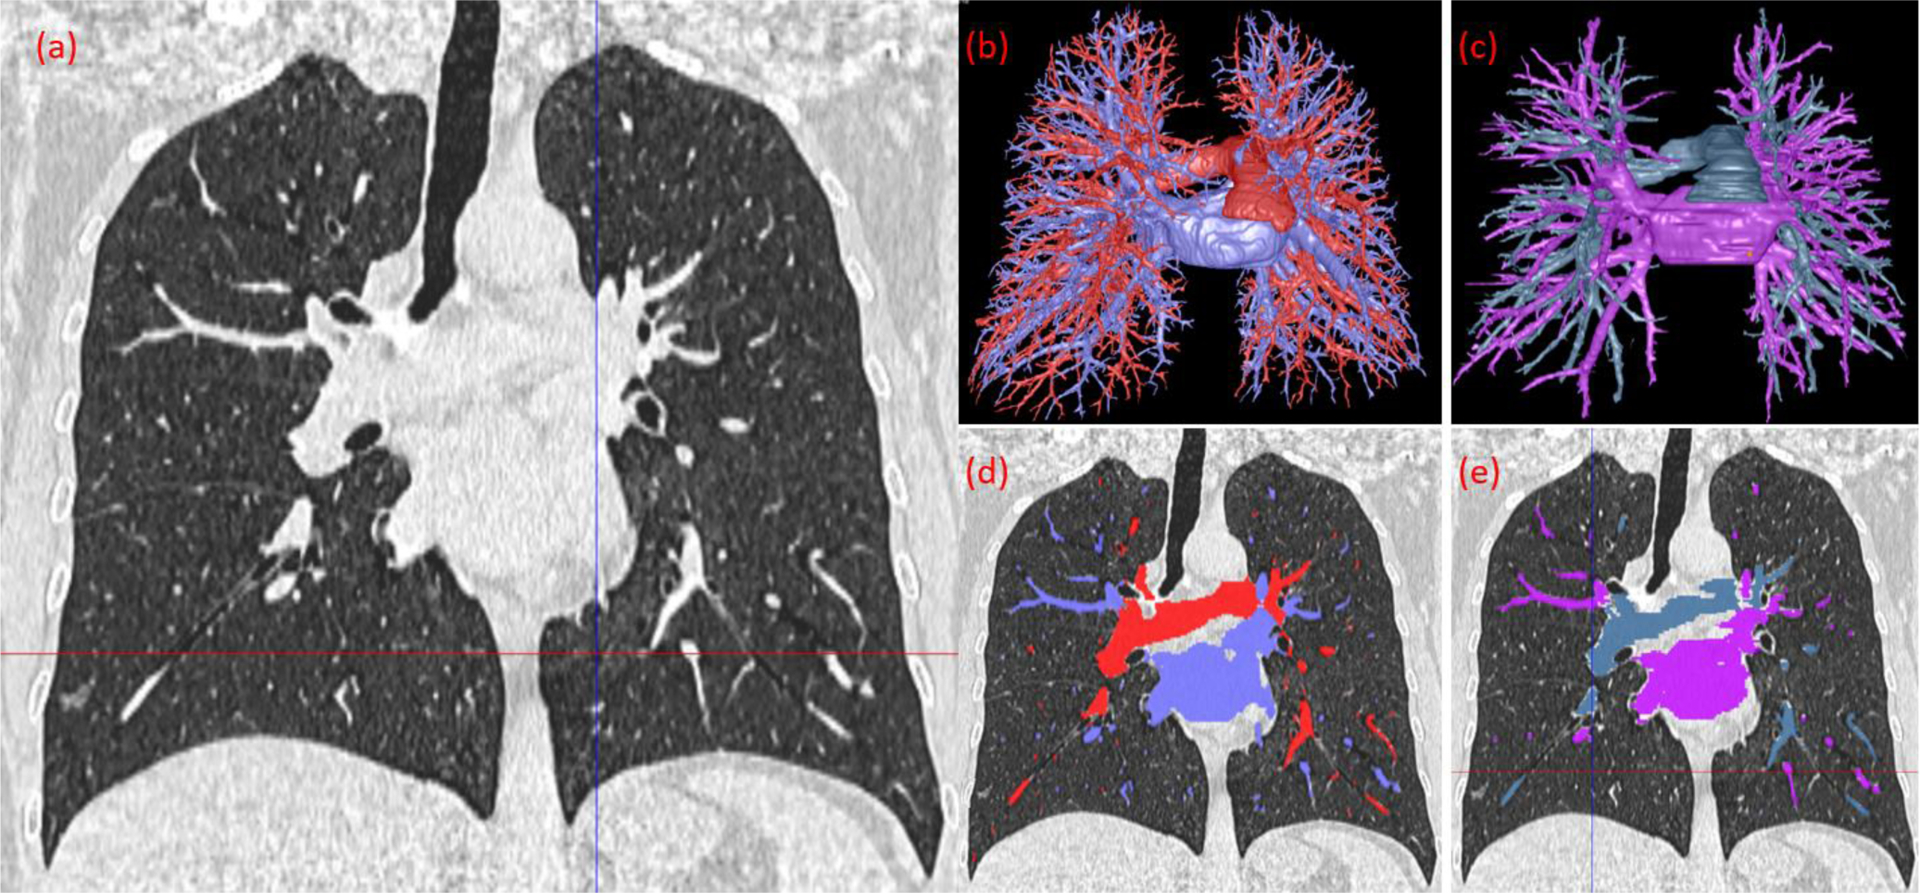
Figure 11.

The computerized results and radiologist’s manual segmentation of the arteries and veins. (a) CT image of the lungs in the coronal view, image thickness of 1.25 mm. (b) 3-D visualization of the computer’s segmentation. (c) 3-D visualization of the radiologist’s segmentation. (d) Overlay of the computer’s segmentation on the CT image. (e) Overlay of the radiologist’s segmentation on the CT image.
