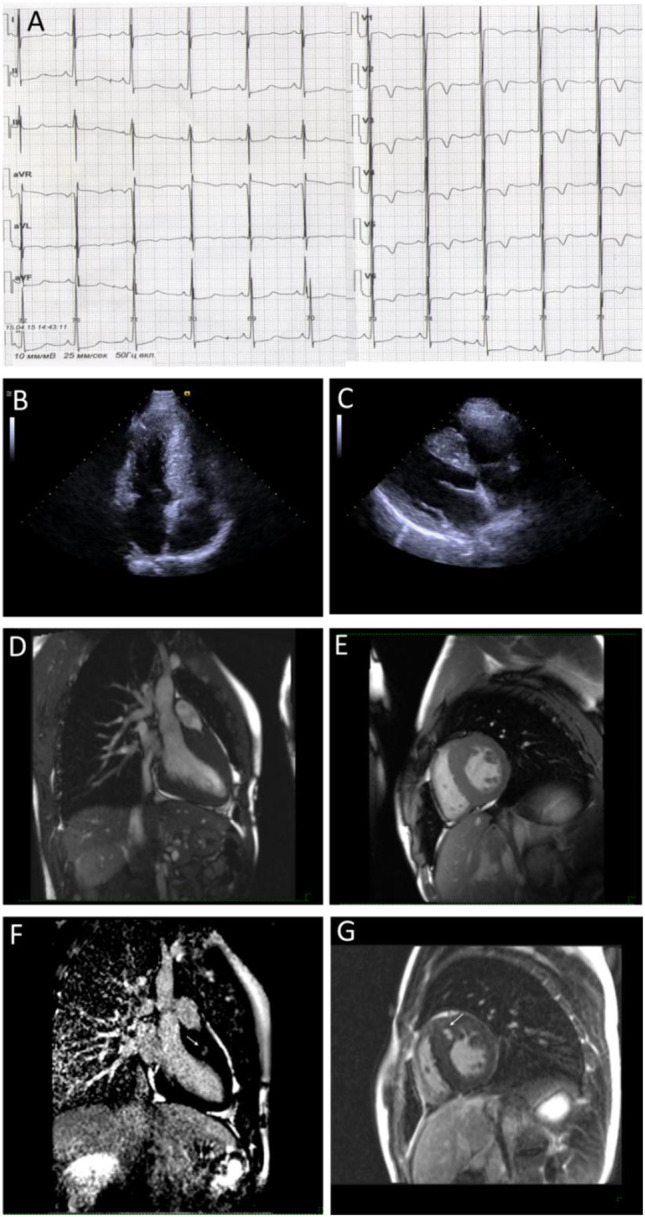
FIGURE 2.

Instrumental findings of Patient 2. Electrocardiogram demonstrates voltage criteria of left ventricle hypertrophy and secondary repolarization changes (A). Echocardiogram correspondence to four-chamber (B) and long-axis view (C) and MRI images in the long (D) and short-axis view (E) confirm wall hypertrophy. Arrows indicate the late gadolinium enhancement phenomenon (F,G) in the basal anteroseptal segment.
