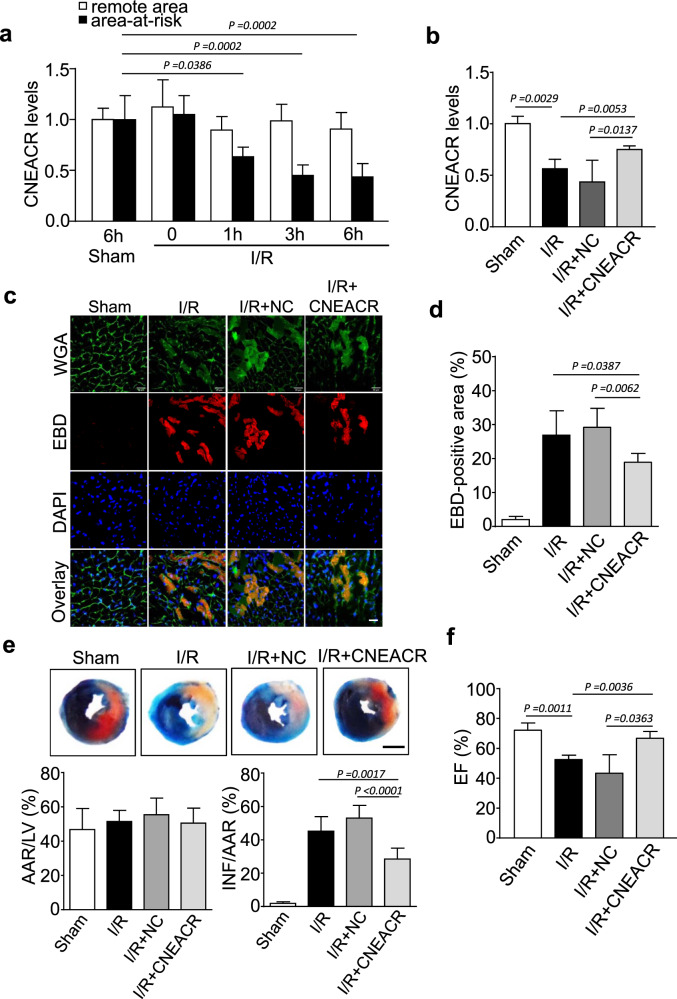
Fig. 2. CNEACR inhibits necrotic cell death in the heart.
a Mice were subjected to ischemia/reperfusion (I/R) at indicated time. Area-at-risk and the remote zone were prepared for qRT-PCR analysis of CNEACR levels. (n = 6 mice per group). b–f Adenoviral vector carrying mouse CNEACR or negative control (NC) were used for the cardiac-specific overexpression of CNEACR and then subjected to 60 min ischemia and 3 h reperfusion (I/R) or Sham in mice. b QPCR analysis showing the level of CNEACR in mice hearts. c Representative fluorescence images showing the Evans blue dye (EBD) (red) incorporation in LV sections counterstained with wheat germ agglutinin (WGA) (green) and DAPI (blue); scales bar, 20 μm. d Statistical analysis of the proportion of the EBD-positive cells in each group (n = 5 mice per group). e The representative images showing Evans blue-TTC stained midventricular heart sections (upper panel, blue-healthy and viable area, white-infarcted area, red-area at risk, Scale Bar, 2 mm). Quantification of the left ventricle infarct size measured as the percentage of left ventricle area (LV) and area at risk (AAR) after I/R or Sham (lower panel, n = 6 mice per group). INF, Infarct area. f Cardiac function (Ejection fraction, EF%) measured using echocardiography analysis after I/R (n = 6 mice per group).

