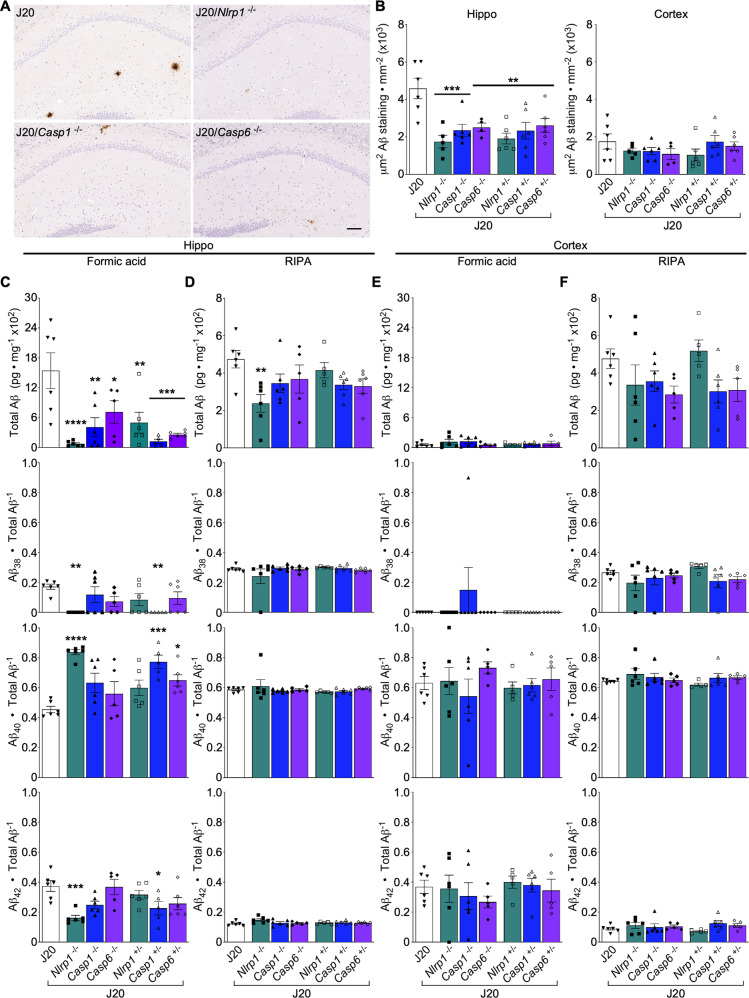
Fig. 5. Nlrp1, Casp1, or Casp6 genetic ablation prevents amyloid deposition in J20 mice.
A Representative Aβ-stained micrographs of the hippocampus. Scale bar = 100 μm. B Aβ+ immunostaining density from the PCL to the SLM in the hippocampal CA1 (left) and cortical retrosplenial and S1 area (right) [Aβ staining density in the hippocampus: F = 6.005, p = 0.0003, n = 6 J20, 5 J20/Nlrp1−/−, 6 J20/Casp1−/−, 4 J20/Casp6−/−, 6 J20/Nlrp1+/−, 6 J20/Casp1+/−, 6 J20/Casp6+/−]. C–F Aβ protein ratios in the hippocampus and cortex (n = 6 J20, 6 J20/Nlrp1−/−, 6 J20/Casp1−/−, 5 J20/Casp6−/−, 6 J20/Nlrp1+/−, 6 J20/Casp1+/−, 6 J20/Casp6+/−) C Hippocampal formic acid-soluble total Aβ [F = 6.730, p = 0.0001], Aβ38/total Aβ [F = 3.254, p = 0.013], Aβ40/total Aβ [F = 7.189, p = 0.000058], and Aβ42/total Aβ [F = 5.026, p = 0.00093]. D Hippocampal RIPA-soluble total Aβ [F = 2.521, p = 0.04], Aβ38/total Aβ, Aβ40/total Aβ, and Aβ42/total Aβ. E Cortical formic acid-soluble total Aβ, Aβ38/total Aβ, Aβ40/total Aβ, and Aβ42/total Aβ. F Cortical RIPA-soluble total Aβ, Aβ38/total Aβ, Aβ40/total Aβ, and Aβ42/total Aβ. Bars represent mean ± SEM of all mice per group; symbols denote individual results. One-way ANOVA, Dunnett’s post-hoc compared to J20 for B-F. *p < 0.05, **p < 0.01, ***p < 0.001, ****p < 0.0001.

