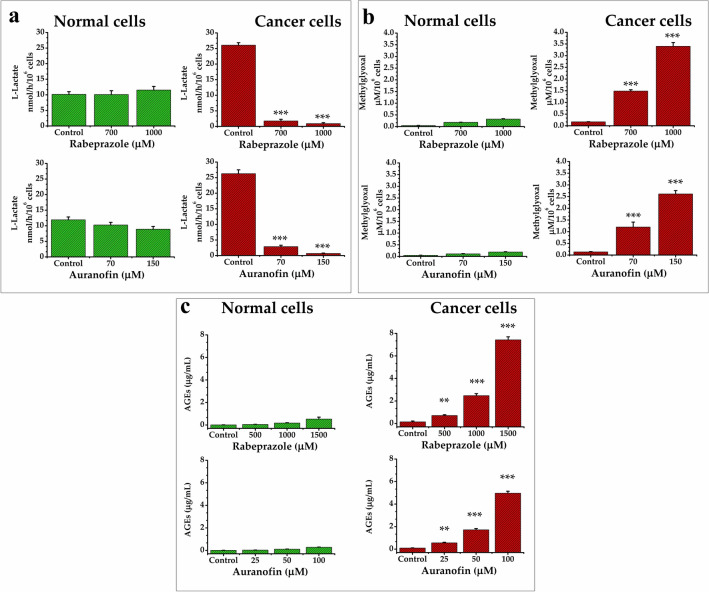
Figure 3.
Quantification of metabolites in normal and cancer cells under drug treatments. Levels of lactate (a), methylglyoxal (b), and Advanced Glycation End products (AGEs) (c) in normal (green) and cancer cells (red) under rabeprazole (upper) or auranofin (bottom) treatments. Results represent the mean of at least four independent experiments. Differences among groups were assessed with one-way ANOVA and Tukey’s test with p value = 0.001 *** or with p value = 0.01**.

