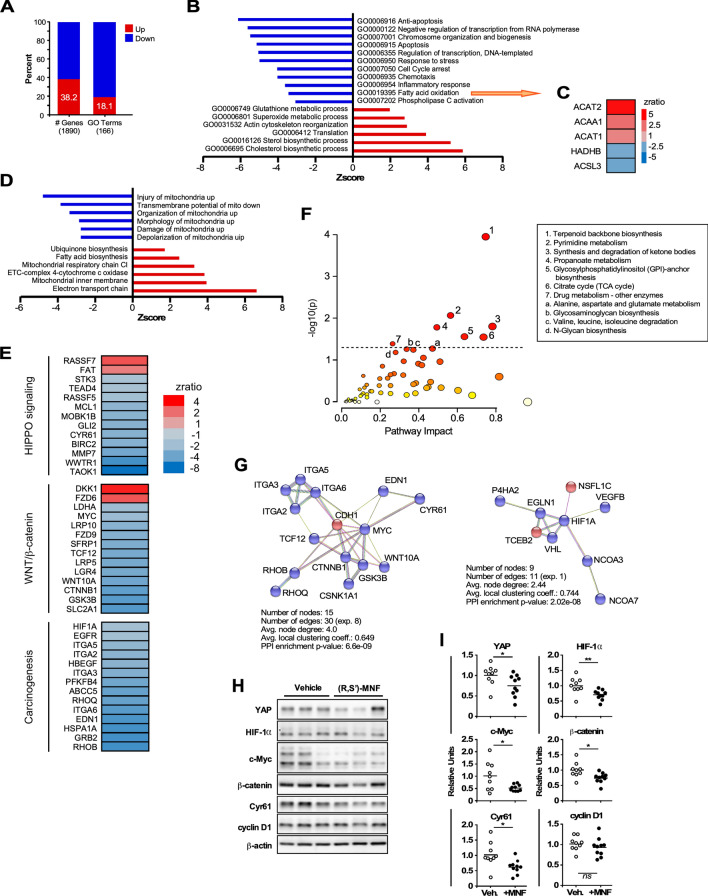
Figure 5.
(R,S′)-MNF treatment elicits distinct gene expression signature in PANC-1 tumor xenografts. (A) Percent of genes and GO Terms that were up- and down-regulated in the (R,S′)-MNF:vehicle pairwise comparison. (B) Enrichment of top GO Terms that were up- (positive Z-scores) and down-regulated (negative Z-scores) after (R,S′)-MNF treatment. (C) Heatmap depicting the expression of genes implicated in fatty acid oxidation that were significantly impacted by (R,S′)-MNF. (D) Enrichment of top GO Terms related to Mitochondrial Pathway dataset from the (R,S′)-MNF:vehicle pairwise comparison. The complete list can be found in Supporting Information Table S5. (E) Heatmap showing the statistically significant Z-ratio changes in expression of selected genes in the (R,S′)-MNF:vehicle pairwise comparison. These genes are implicated in a handful of pro-oncogenic signaling pathways, including Hippo, Wnt-β-catenin, and EGF receptor. (F) Input for the multi-omics Joint Pathway Analysis (JPA) from MetaboAnalyst 5.0 consisted of the 74 metabolites gathered in Supporting Information Table S2 and the 1890 differentially expressed transcripts identified by microarray profiling. y axis, enrichment significance; x axis, pathway impact for network topology. Dotted line highlights pathways significantly impacted as defined by enrichment significance P < 0.05 [log(P) > 1.3]. (G) String protein–protein interaction database (v 11.5; string-db.org) was used to visualize the putative impact of (R,S′)-MNF on functional c-Myc (left panel) and HIF-1α (right panel) protein–protein association based on the transcriptional responses of PANC-1 tumors to (R,S′)-MNF treatment. Red nodes, significantly upregulated genes; blue nodes, significantly downregulated genes. In String network analysis, nodes represent proteins whereas edges represent functional protein–protein associations. If the number of edges for analyzed dataset is higher than expected for a random set of proteins (the ‘exp.’ value), the clustered proteins are biologically connected as a group. The average node degree indicates how many interactions a protein has on average in the network. The clustering coefficient is a measure of how connected the nodes in the network are. Protein–protein interaction (PPI) enrichment P-value is a measure of significance for biological association of investigated proteins. (H) Lysates prepared from PANC-1 tumor xenografts were separated by SDS-PAGE and immunoblotted using primary antibodies specific for YAP, HIF-1α, c-Myc, β-catenin, CYR61, cyclin D1, and β-actin (n = 9–10 mice per group). Representative blots are depicted. (I) Scatter plots depict densitometric quantitation of each protein band followed by normalization to β-actin levels. *, **P < 0.05, < 0.01 vs. control. The heatmaps were created using Microsoft Excel v.16.56 for Mac (Redmond, WA). The bar graphs and scatter plots were generated with GraphPad Prism v.8.4.3 (GraphPad Software, Inc., La Jolla, CA).

