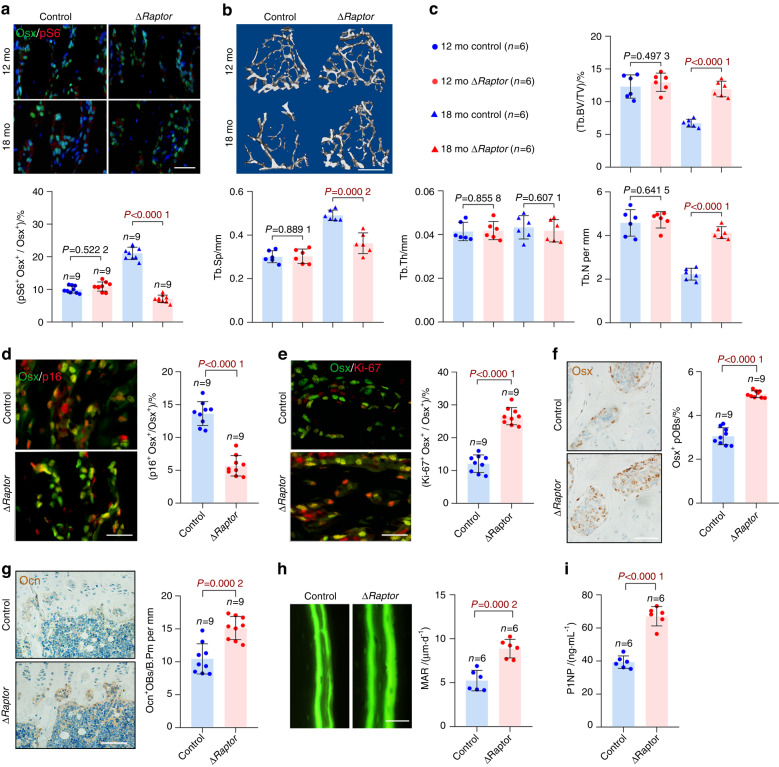
Fig. 3.
mTORC1 inactivation alleviates preosteoblast senescence and bone loss. a Double immunostaining of Osx and pS6 and quantification of pS6+ preosteoblasts (pS6+ Osx+) relative to total preosteoblasts (Osx+) in the tibias of 12- and 18-month-old ΔRaptor mice. Scale bar, 100 μm. Representative microcomputed tomography (μCT) images (b) and quantification of trabecular bone (c) in the 12- and 18-month-old ΔRaptor tibias compared with those from the littermate controls. Scale bar, 500 μm. Double immunostaining of Osx plus p16 (d) and Osx plus Ki-67 (e) in tibias. Double positively stained cells were quantified. Scale bars, 100 μm. IHC staining for Osx (f) and osteocalcin (Ocn) (g) in the tibias of the 18-month-old ΔRaptor mice and their littermate controls. Scale bar: 100 μm. Osx-positive preosteoblasts (Osx+ pOBs) were quantified as cell numbers per total cells in the bone marrow. Ocn-positive mature osteoblasts (Ocn+OBs) on the bone surface were measured as cells per millimeter of perimeter in the sections (/B.Pm). h Representative images of calcein labels and quantification of the mineral apposition rate (MAR) in femurs from the 18-month-old ΔRaptor mice and their littermate controls. Scale bar = 50 μm. i Serum levels of P1NP in the 18-month-old ΔRaptor mice and their littermate controls determined by ELISAs. Data are shown as the mean ± SD. The numbers of samples (n) are indicated in each figure panel. P values were determined by two-tailed Student’s t test for single comparisons

