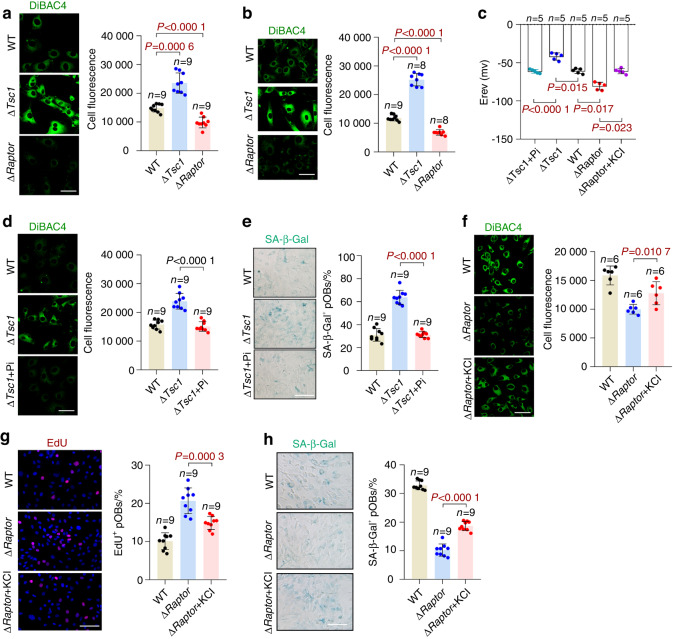
Fig. 5.
Plasma membrane depolarization contributes to preosteoblast senescence. Senescent wild-type (WT), ΔTsc1, and ΔRaptor preosteoblasts isolated from calvaria (a) or long bones (b) were incubated with fluorescent DiBAC4 dye and photographed under a confocal microscope. Scale bars, 50 μm. Cell fluorescence was measured as the mean corrected total cell fluorescence (CTCF) of all the cells in nine different images taken at ×400 magnification in ImageJ. Depolarization is indicated by increased fluorescence. c Histograms showing the mean reversal potentials (Erev) of ramp membrane currents determined by the patch-clamp technique in the different indicated preosteoblasts. d Representative confocal images of DiBAC4 fluorescence in the senescent ΔTsc1 preosteoblasts treated with pinacidil (Pi). Scale bar, 50 μm. The fluorescence intensity of the cells was measured. e SA-β-gal staining of the cells in d and quantification of the proportion of SA-β-gal-positive cells in each population. Scale bar, 100 μm. f DiBAC4 fluorescence in the senescent ΔRaptor preosteoblasts treated with KCl. Relative plasma membrane potentials were measured. g Immunostaining of EdU in the cells in f and quantitative analysis of EdU+ cells relative to total cells. Scale bar, 100 μm. h SA-β-gal staining of the cells in f and quantification of the proportion of SA-β-gal-positive cells. Scale bar, 100 μm. Data are shown as the mean ± SD. The numbers of samples (n) are indicated in each figure panel. P values were determined by two-tailed Student’s t test for single comparisons

