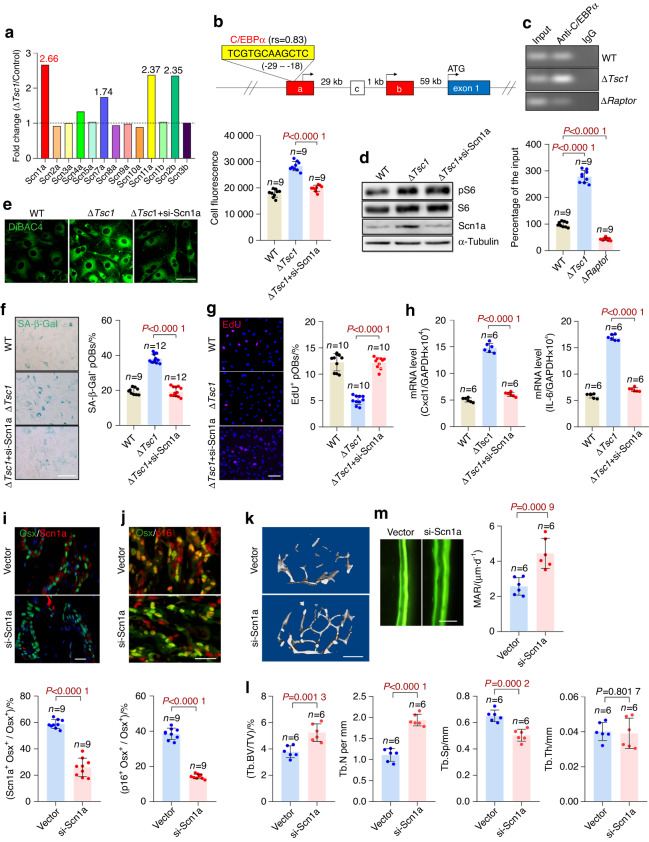
Fig. 6.
The sodium channel Scn1a mediates plasma membrane depolarization in senescent preosteoblasts. a mRNA expression of voltage-sensitive sodium channels in the ΔTsc1 and control calvarial preosteoblasts indicated by our previous global mRNA expression profile (GSE74781). b Binding site of C/EBPα in the 5′-UE of Scn1a (yellow box) predicted by the JASPAR database (http://jaspar.genereg.net). rs: JASPAR relative scores, which are defined as 1 for the maximum-likelihood sequence. Boxes represent exons: blue coding exons, red noncoding exons conserved between humans and mice, white noncoding exons identified in either human or mouse transcripts. Noncoding exons are named alphabetically, and the first coding exon (exon 1) of the Scn1a gene is indicated. Genomic distances between exons are indicated. c Binding of C/EBPα to the 5′-UE sequence of Scn1a in vivo, determined by a ChIP assay using the ΔTsc1 and ΔRaptor cells and anti-C/EBPα antibody or IgG. The ChIP samples were then subjected to qPCR with the Scn1a 5′-UE primers. The percentage of the input of the sample by using the anti-C/EBPα antibody in the wild-type cells was normalized to 100. The ΔTsc1 osteoblasts were transfected with Scn1a siRNA and subjected to (d) Scn1a detection with western blotting, (e) measurement of relative plasma membrane potential with DiBAC4 dye, (f) SA-β-gal staining and quantification of the proportion of SA-β-gal-positive cells, (g) immunostaining of EdU and quantitative analysis of EdU+ cells relative to total cells, and (h) qPCR analysis of IL-6 and Cxcl1 mRNA. Double immunostaining of Osx plus Scn1a (i) and Osx plus p16 (j) in the tibias of the 18-month-old ΔTsc1 mice injected with adenovirus encoding si-Scn1a for 1 month. Double positively stained cells were quantified. Representative μCT images (k) and quantification of trabecular bone (l) in the mice. (m) Representative images of calcein labels and quantification of the mineral apposition rate (MAR) in femurs from the 18-month-old ΔTsc1 mice receiving si-Scn1a. Scale bars: 50 μm in e, g, m; 100 μm in i, j; and 500 μm in k. Data are shown as the mean ± SD. The numbers of samples (n) are indicated in each figure panel. P values were determined with two-tailed Student’s t test for single comparisons

