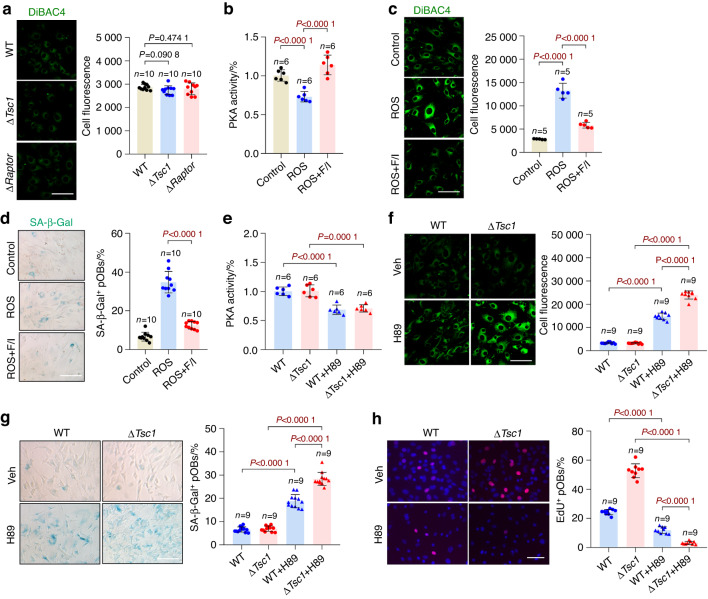
Fig. 7.
Prosenescent stress activates Scn1a by inhibiting PKA. a Replicative wild-type (WT), ΔTsc1 and ΔRaptor calvarial osteoblasts were incubated with the fluorescent DiBAC4 dye and photographed under a confocal microscope. Scale bar, 50 μm. Relative plasma membrane potentials were measured. ROS-induced senescent wild-type preosteoblasts were treated with F/I (forskolin + IBMx, PKA activator) or left untreated. The cells were subjected to (b) measurement of total cellular PKA activities, (c) DiBAC4 staining and measurement of relative plasma membrane potentials. Scale bar, 50 μm. d SA-β-gal staining of cells in b and quantification of the proportion of SA-β-gal-positive cells in each population. Scale bar, 100 μm. Replicative WT and ΔTsc1 osteoblasts were treated with H-89 (PKA inhibitor) and were subjected to (e) measurement of total cellular PKA activities, (f) DiBAC4 staining and measurement of relative plasma membrane potentials. Scale bar, 50 μm. g SA-β-gal staining of cells in e and quantification of the proportion of SA-β-gal-positive cells in each population. Scale bar, 100 μm. h Immunostaining of EdU in cells in e and quantitative analysis of EdU+ cells relative to total cells. Scale bar, 100 μm. Data are shown as the mean ± SD. The numbers of samples (n) are indicated in each figure panel. P values were determined by two-tailed Student’s t test for single comparisons

