Figure 4.
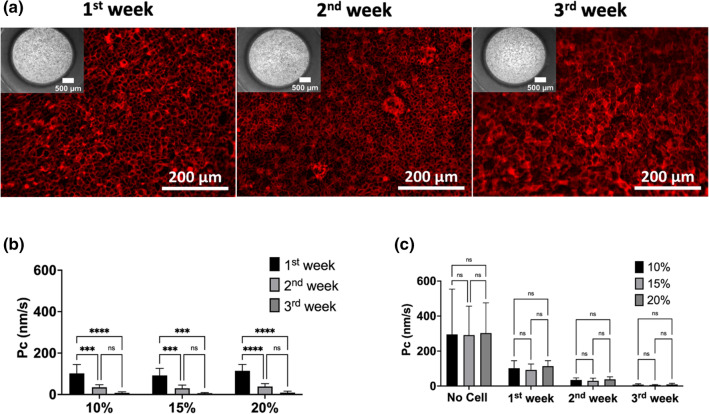
Biological validation of 96-well inserts. (a) Growth of Caco-2 cells on the 15% (w/v) gelatin membranes over three weeks. The 10% and 20% cultures had identical morphologies, so only the 15% cultures are displayed. Insert apertures at the bottom are shown at upper panels of fluorescence images (the magnification: 4x; scale bars: 500 µm), and the F-actin (red) stain of the cells on the hydrogel membranes (scale bars: 200 µm; the magnification was 20x). (b) Permeability coefficient (mean + SD) of lucifer yellow across Caco-2 cells on the 10%, 15%, 20% (w/v) gelatin membrane assembled inserts (n ≥ 3) and (c) comparison of Pc values of empty hydrogel, 10%, 15%, 20% membrane assembled inserts (n ≥ 5). Error bars indicate mean S.D. statistical significance: ns = P > 0.05, ****P < 0.001, ****P < 0.0001.

