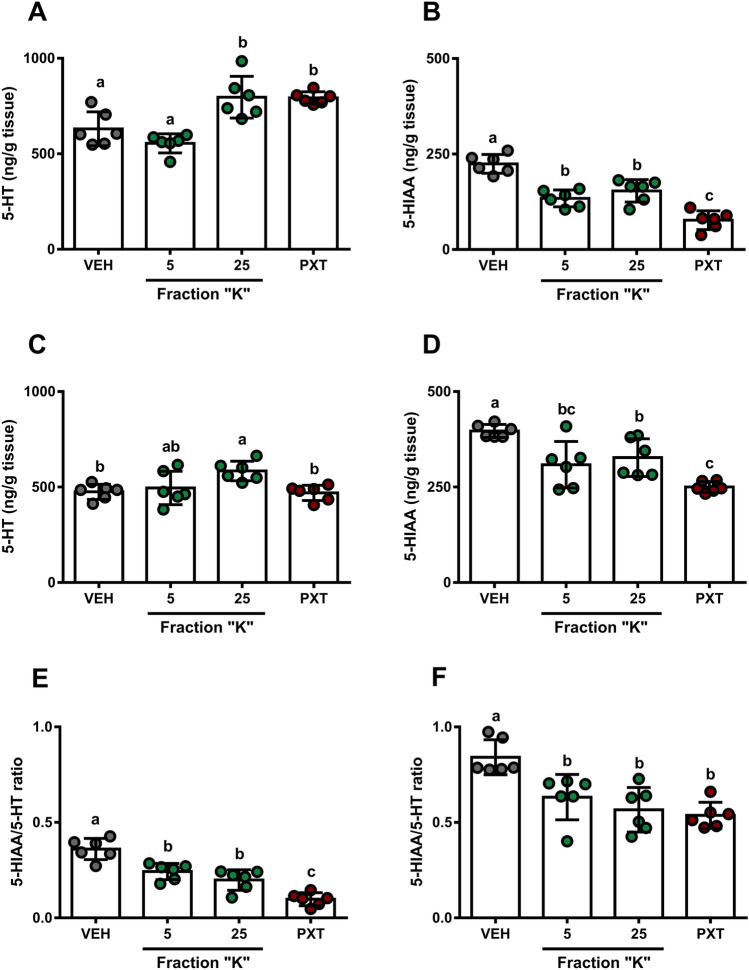
Figure 6.
Regional brain tissue levels of 5-HT and 5-HIAA following fraction “K” and PXT treatments. (A,B,E) Prefrontal cortex. (C,D,F) Hippocampus. Mean (± SD; ng/g tissue) levels of prefrontal cortex (A) 5-HT, (B) 5-HIAA, and (E) 5-HIAA/5-HT ratios follow doses of fraction “K” (mg/kg dose indicated, all panels) or PXT (10 mg/kg, all panels). Mean (± SD; ng/g tissue) levels of hippocampus (C) 5-HT, (D) 5-HIAA, and (F) 5-HIAA/5-HT ratios follow doses of fraction “K” (mg/kg dose indicated, all panels) or PXT (10 mg/kg, all panels). One-way ANOVA followed by a Tukey’s HSD: p < 0.0001, all panels. Different letters indicate significant differences (p < 0.0332).

