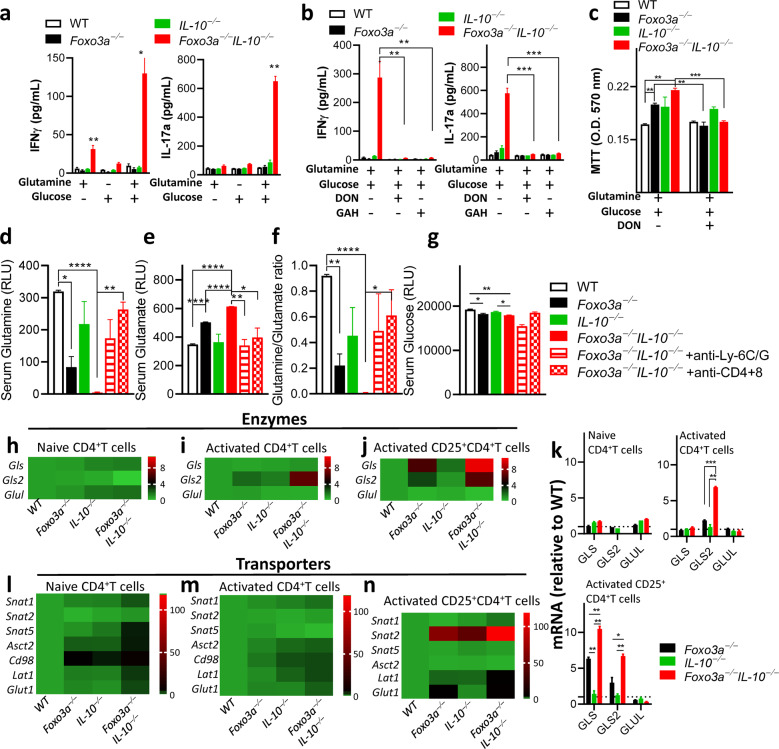
Fig. 6. Foxo3a favors glutamine synthesis by repressing the expression of glutaminase and glutamine transporters.
a, b IFNγ and IL-17a levels were measured (at 72 h) in the supernatants of anti-CD3/CD28 activated CD4+ T-cells supplemented with either 10 mM glucose or 2 mM glutamine or both in the absence or presence of the glutamine antagonist DON (50 μM) and inhibitor of glutamine transport GAH (1 mM). c MTT uptake was evaluated in activated CD4+ T-cells in glucose/glutamine free media supplemented with either 10 mM glucose or 2 mM glutamine or both in the absence or presence of the inhibitors DON (50 μM) and GAH (1 mM). d–g Glutamine, glutamate, glutamine/glutamate ratio, and glucose levels were measured (as relative light units) in the sera of mice. h–j, l–n Heatmaps showing the expressions of major metabolic transporters and glutamine metabolism-associated enzymes (relative to wildtype cells) in non-activated and activated CD4+ and activated CD25+ CD4+ T-cells normalized to actin. Values are fold-change relative to WT cells. k Expressions of glutamine metabolism-associated enzymes by q-RT PCR normalized to actin. Values are fold-change relative to WT cells. All graphs depict mean ± SEM. Statistics were done using One-way ANOVA (*P < 0.05, ***P < 0.001 and ****P < 0.0001).

