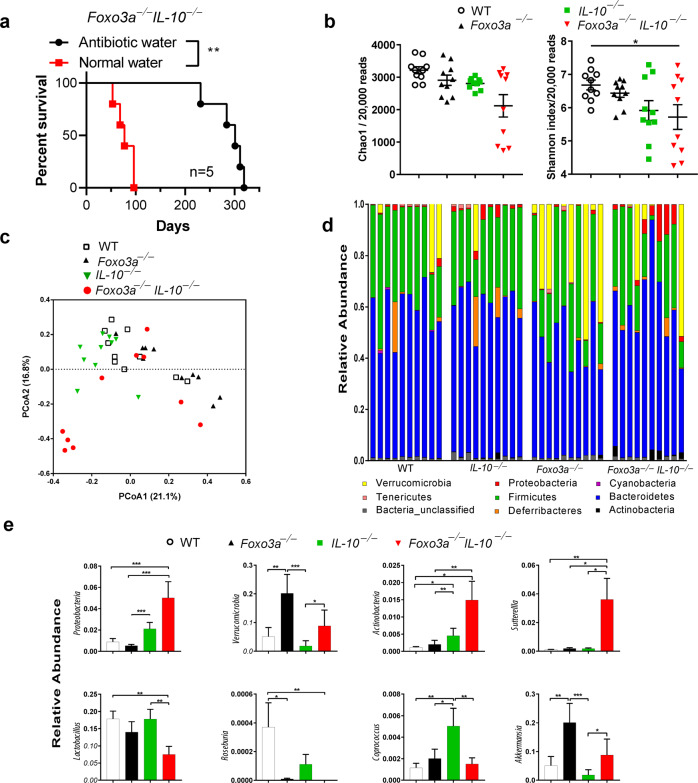
Fig. 7. FoxO3a regulates the abundance of gut microbiota.
a Survival of FoxO3a−/−IL-10−/−mice with and without antibiotic treatment. FoxO3a−/−IL-10−/− mice (n = 5; age 5–8 weeks of age) received a 2 month-course of antibiotic treatment consisting of Ciprofloxacin (0.225 mg/mL) and Metronidazole (0.45 mg/mL) in their drinking water. Then, they were maintained on antibiotic-free water for the remainder of the study. As a control group, 5 mice received antibiotic-free drinking water. The numbers of spontaneous deaths were recorded over the course of time. Data was analyzed using Mantel–Cox test. (*P < 0.05, ***P < 0.001, and ****P < 0.0001). b Diversity of intestinal microbiota in WT, IL-10−/−, FoxO3a−/−, and FoxO3a−/−IL-10−/−mice (n = 10 each). Chao1 estimates and Shannon indices were calculated from rarefied 20,000 reads per sample. Lines represent mean ± SEM. Data was analyzed using Kruskal-Wallis test and Two-stage Benjamini, Krieger, and Yekutieli FDR procedure (*P < 0.05). c Principal Coordinate Analyses (PCoA) based on Bray-Curtis distances. PCoA was conducted using QIIME 1.9.0 on 20,000 randomly selected reads per sample. The samples were colored by mice phenotype. PCoA1and PCoA2 represent the top two coordinates that captured the highest variability between samples and the percentage shown indicates the fraction of variation represented by each coordinate. Adonis analysis was used to test for the statistical significance of sample grouping by the mice phenotypes (R2 = 0.21039; P = 0.001). d Relative abundance of the identified phyla in each sample. Samples are grouped by mice phenotype (n = 10/group). e Relative abundance of differentially abundant taxa among the microbiota of WT, IL-10−/−, FoxO3a−/−, and FoxO3a−/− IL-10−/−mice. Lines represent mean. Data was analyzed using Kruskal-Wallis test and Two-stage Benjamini, Krieger, and Yekutieli FDR procedure (*P < 0.05, **P < 0.01, and ***P < 0.001).

