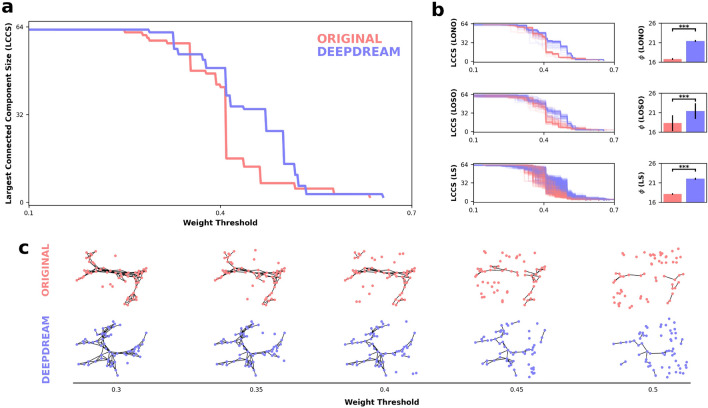
Figure 3.
Network percolation and statistical results. (a) Line plot representing the percolation process of the OR (red) and DD (blue) full networks. The x-axis represents the weight threshold, starting from the smallest weight in the network (0.1) to a weight strength in which the giant component is smaller than three nodes (0.7). (b) On the left, line plots of the LONO, LOSO, and LS procedures. Each line is an iteration, colors encode the conditions. On the right, barplots show the between conditions and across the three procedures. Error bars represent the standard error of the mean (SEM). Horizontal black bars represent statistical significance. (c) OR and DD semantic networks undergoing the percolation process, visualized at different weight thresholds.

