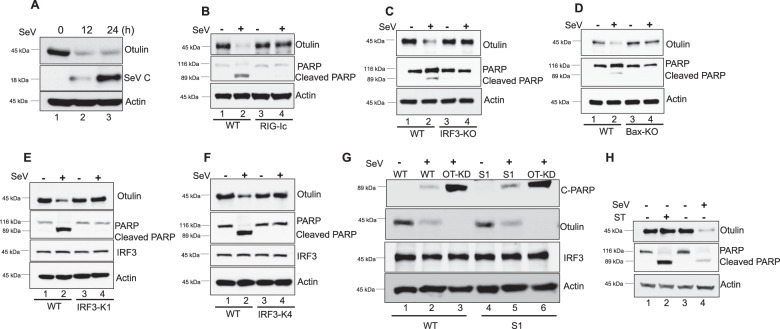
Fig. 2. RIPA causes degradation of Otulin.
A HT1080 cells were infected with SeV (MOI 10) for the indicated time points and analyzed for Otulin expression, using Otulin antibody. Viral protein synthesis was assessed with SeV C antibody. B Otulin degradation and PARP cleavage were analyzed in HT1080 WT or HT1080 cells expressing RIG-Ic (RIG-I dominant-negative mutant); cells were either mock or SeV infected for 24 h. Otulin degradation was assessed with Otulin antibody while Cleaved PARP levels were assessed as a measure for apoptosis. C Otulin degradation and PARP cleavage were analyzed in MEF WT or MEF IRF3-KO cells, which were either mock or SeV infected for 24 h. Otulin degradation was assessed with Otulin antibody while C-PARP levels were assessed as a measure for apoptosis. D Otulin degradation and PARP cleavage were analyzed in MEF WT or MEF Bax-KO cells, which were either mock or SeV infected for 24 h. Otulin degradation was assessed with Otulin antibody while C-PARP levels were assessed as a measure for apoptosis. E Otulin degradation and PARP cleavage were analyzed in HT1080 WT and RIPA deficient HT1080 IRF3-K1 cells, which were either mock or SeV infected for 24 h. F Analysis similar to E comparing WT and IRF3-K4 cells. G Otulin degradation and PARP cleavage were analyzed in HT1080 WT, HT1080-OT-KD, HT1080S1 and HT080S1-OT-KD cells after mock or SeV infection for 24 h. H Otulin degradation and PARP cleavage were analyzed in HT1080 cells which were either treated with Staurosporine (50 nM) or infected with SeV for 12 h.). Quantification of western blots and statistical analyses are provided in Supplementary Fig. 8 (mean ± SEM, n = 3; ns > 0.05; *P < 0.05; **P < 0.01, ***P < 0.001).

