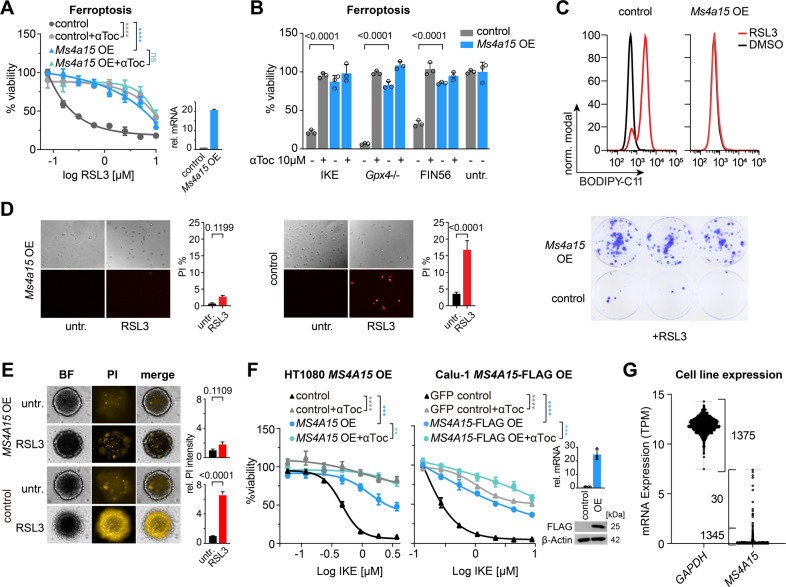
Fig. 1. MS4A15 specifically protects cells against ferroptosis.
A Dose-response curve of Ms4a15-overexpressing immortalized mouse fibroblasts (Ms4a15 OE) compared to empty vector control cells (control) against RSL3 treatment (16 h). Viability was detected by percent Resazurin conversion relative to respective untreated cells. Addition of 10 μM α-tocopherol (αToc) serves as rescue control for ferroptosis. Inset shows relative Ms4a15 expression by qPCR (rel. mRNA). cT values are 31.1 and 27.4 for control and Ms4a15 OE, respectively. B Survival of Ms4a15 OE cells compared to control against ferroptosis inducers: 2 μM IKE (16 h), Gpx4–/– (72 h) by 1 μM 4-hydroxy-tamoxifen induction and 10 μM FIN56 with 10 μM αToc rescue. Significance was evaluated by two-tailed t-test. C Lipid peroxidation induced by RSL3 (0.3 μM) treatment for 3 h in Ms4a15 OE and control cells measured by BODIPY 581/591 C11 stain (BODIPY-C11). A typical FACS histogram of three independent experiments is depicted. D Brightfield and propidium iodide images and quantification (PI %) of Ms4a15 OE cells compared to control following 16 h RSL3 (0.5 μM) challenge (left). PI values at this timepoint likely underestimate cell death due to cell detachment, as observed in phase contrast images. (Right) Clonogenic survival at 7 d following 16 h RSL3 (1.25 μM) treatment in a colony-forming assay. E 3D-spheroids of Ms4a15 OE and control cells grown for 4 d and treated with 2 µM RSL3 for 16 h before PI staining. Relative (rel.) PI intensity was calculated versus untreated spheroids (n = 4). F Viability of human HT1080 (D) and Calu-1 (E) MS4A15-overexpressing cells (±FLAG) challenged with IKE compared to empty control. Insets show MS4A15 expression by qPCR or western. G mRNA expression level of MS4A15 in 1375 CCLE cancer cell lines compared with GAPDH. Relative mRNA expression is shown as mean ± SD of n = 3 technical replicates of three independent experimental repetitions. Viability data are plotted as representative mean ± SD of n = 3 technical replicates for independent experiments repeated at least three times with similar outcomes. Curve statistics, p-values of two-way ANOVA, are shown for comparisons. *P < 0.05, **P < 0.01, ***P < 0.001, ****P < 0.0001.

