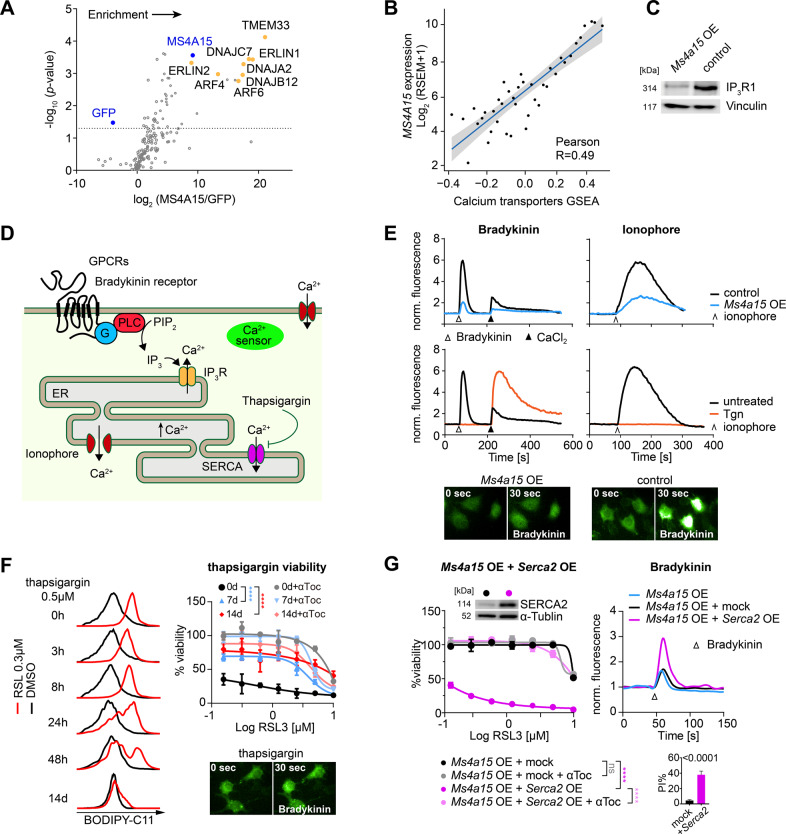
Fig. 2. MS4A15 regulates calcium-mediated ferroptosis.
A Enrichment of MS4A15-FLAG co-immunoprecipitated proteins in HEK293T cells as determined by label-free proteomic quantification. Mean abundance ratios were calculated compared to GFP-expressing cells incubated with anti-FLAG as a control. Dotted horizontal line indicates significance (paired t-test, p < 0.05). B Single sample Gene Set Enrichment Analysis (GSEA) correlation analysis in primary lung tumors between MS4A15 and Ca2+ transmembrane transporters (RSEM, RNA-Seq by Expectation-Maximization). Significance was evaluated by Pearson correlation. C Western blot of IP3R1 protein in Ms4a15 OE and control cells. Vinculin is given as loading control. D Schematic of calcium related processes in (E–G). Activation of G protein-coupled receptors (GPCRs) such as Bradykinin receptor stimulates phospholipase C (PLC) cleavage of phosphatidylinositol 4,5-bisphosphate (PIP2) to yield IP3, triggering Ca2+ release from the endoplasmic reticulum (ER). Thapsigargin (Tgn) blocks SERCA-mediated ER Ca2+ uptake, while ionophore catalyzes nonspecific store release in Ca2+ free medium. Membrane channels mediate uptake following re-addition of CaCl2-containing medium. E Calcium levels detected by cytosolic sensor GCaMP6s using flow cytometry (normalized fluorescence, ex488/em530 nm). Top panels: ER Ca2+ release mediated by 50 nM Bradykinin (∆) or 5 μM Ionophore (^) in Ms4a15 OE compared to control cells in Ca2+-free buffer. Bottom panels: control cells pretreated with 50 nM Tgn for 3 h. Addition of 2 mM CaCl2 (▲). Data shown are representative results of three independent repetitions performed in triplicate with similar outcomes. Fluorescent images were acquired 30 s following Bradykinin stimulation for respective genotypes. F Time-dependent (0 h–14 days) effect of Tgn pretreatment on lipid peroxidation detected by BODIPY-C11 induced by RSL3 (0.3 μM for 3 h) in control cells (left panels) compared to DMSO. A typical FACS histogram of three independent repetitions is depicted. Viability of control cells pretreated with 2.5 nM Tgn for 7 days or 14 days prior to RSL3 induction (untreated, 0 days). Fluorescent images were acquired 30 s following Bradykinin stimulation for 14 d treated cells. G Dose-dependent sensitization of Ms4a15 OE cells to RSL3 by overexpressing Serca2 (Ms4a15 OE + Serca2 OE) or empty virus control (Ms4a15 OE + control) in Ms4a15 OE cells (left panel). Restoration of Ca2+ dynamics is indicated by Bradykinin (right panels). Insets show SERCA2 expression by western and viability (PI%) measurements in respective cell lines. Viability data are representative mean ± SD of n = 4 (F) or n = 3 (G) replicates for experiments repeated independently at least three times. Curve p-values of two-way ANOVA comparisons are shown. *P < 0.05, **P < 0.01, ***P < 0.001, ****P < 0.0001.

