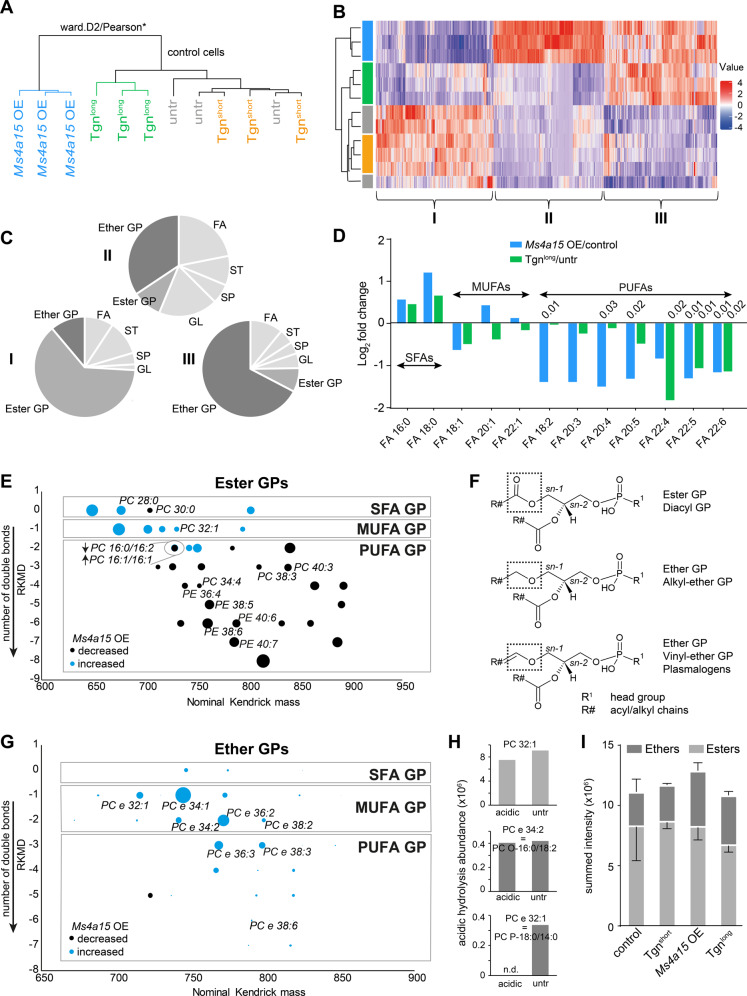
Fig. 3. Lipid dysregulation in Ms4a15 OE cells.
Global lipidomics analysis of Ms4a15 OE, control cells treated with Tgnshort (3 h), control cells treated with Tgnlong (16 h), and untreated control cells. A Dendrogram indicating separation of untreated Ms4a15 OE and Tgnlong treated control cells from untreated and Tgnshort treated control cells by hierarchical cluster analysis. Similarly regulated lipid species from Ms4a15 OE and Tgnlong were extracted and plotted in the heatmap. B Lipid abundance heatmap showing z-score profiles of species similarly downregulated in both Ms4a15 OE and Tgnlong (group I), exclusively upregulated in Ms4a15 OE (group II), and similarly upregulated in Ms4a15 OE and Tgnlong (group III). Sample colors correspond to A. (n = 3, Wilcoxon–Mann–Whitney-Test, BH corrected). C Modulated lipid classes in groups I–III by LIPID MAPS Structure Database. GP glycerophospholipid, FA fatty acid, ST sterol Lipid, SP sphingolipid, GL glycerolipid. Ether GPs and ester GPs are in dark colors. D Free fatty acid fold change in Ms4a15 OE and Tgnlong compared to untreated control. SFAs saturated fatty acids, MUFAs monounsaturated fatty acids, PUFAs polyunsaturated fatty acids. Significant p-values of two-way t-test comparisons versus control are shown. E Kendrick plot of significantly modulated diacylglycerophospho-ethanolamine (PE) and -choline (PC) ester phospholipids. All species have a referenced Kendrick mass-defect (RKMD) value of 0 (saturated chains) or a negative integer (number of unsaturated bonds). Dot sizes indicate absolute values of log2(mean Ms4a15 OE/mean control) (n = 3). p < 0.05, Wilcoxon–Mann–Whitney-Test, BH corrected). F Model structures of diacyl (esters), plasmanyl (ethers) and plasmenyl (vinyl-ethers). The latter are also termed plasmalogens. G Kendrick plot of significantly modulated ether GPs (PE and PC). Dot sizes indicate summed peak intensity. For given species isomeric plasmalogens are validated by acidic hydrolysis (see Supplementary Table 2) and (H). ‘PC e’ or ‘PE e’ represent the respective ether species of PC or PE, n = 3, p < 0.05, Wilcoxon–Mann–Whitney-Test, BH corrected). H Acidic hydrolysis abundance illustrated for one ester (top), one alkyl-ether (middle) and one vinyl-ether GP (bottom). I Summed intensities for all detected GP show a slight reduction of ester GPs as well as enrichment in ether GP for Ms4a15 OE and Tgnlong. Data shown represent mean ± SD of n = 3 technical replicates.

