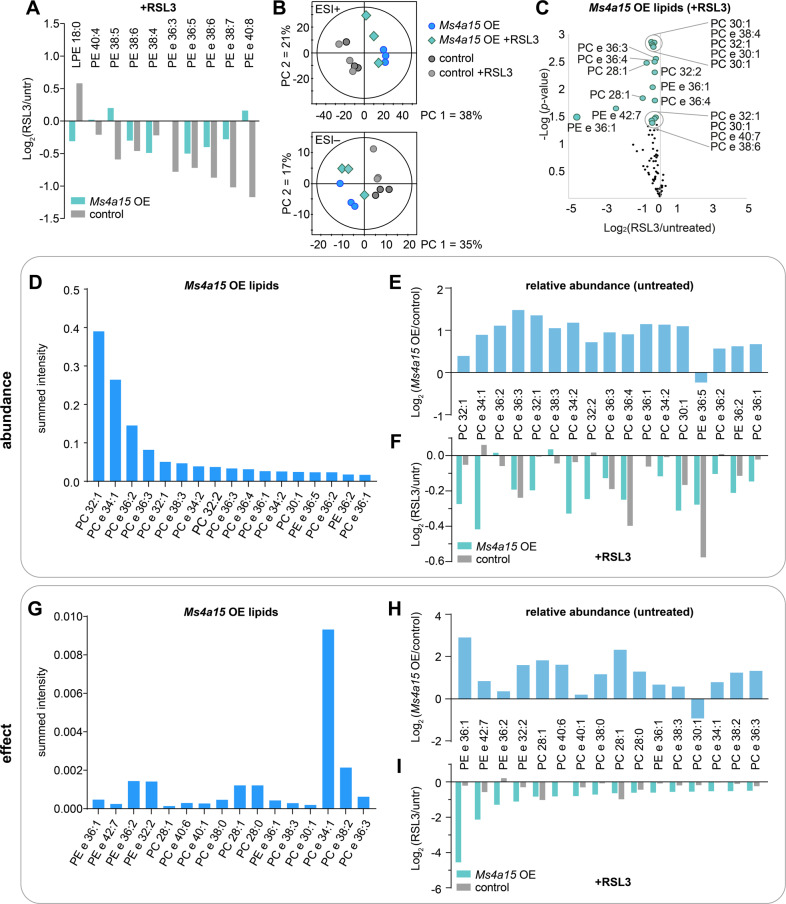
Fig. 4. Ms4a15 OE defines MUFA-lipids and -plasmalogens as ferroptosis targets.
A Targets of lipid peroxidation are affected by RSL3 treatment (3 h) in control and Ms4a15 OE cells. ‘LPE’ indicates lyso-form of PE. B PCA scores plot for positive (ESI+) and negative (ESI−) electrospray ionization mode indicating the global lipid profile in Ms4a15 OE and control cells under untreated or RSL3 treatment conditions. PCAs were based on 924 annotated PL, GL and FA primary affected lipid classes in ferroptosis. C Significantly increased lipids in Ms4a15 OE are affected by 3 h RSL3 treatment of Ms4a15 OE. Volcano plot of log2(fold change) following RSL3 treatment. Larger dots are significant (p < 0.05, n = 3, two-sided Welch test) for changes due to RSL3. D–F Significantly modulated lipids in Ms4a15 OE compared to control, ranked by abundance. Summed peak area of all samples (A) is shown in (D). E Fold change of these species in Ms4a15 OE compared to control cells, under untreated conditions. F Fold change of these species in Ms4a15 OE and control cells upon 3 h RSL3 treatment. G–I Significantly modulated lipids in Ms4a15 OE compared to control, ranked by RSL3 effect. Summed peak area of all samples (A) is shown (G). H Fold change of these species in Ms4a15 OE compared to control cells, under untreated conditions. I Fold change of these species in Ms4a15 OE and control cells upon 3 h RSL3 treatment. Data shown represent mean of n = 3 technical replicates.

