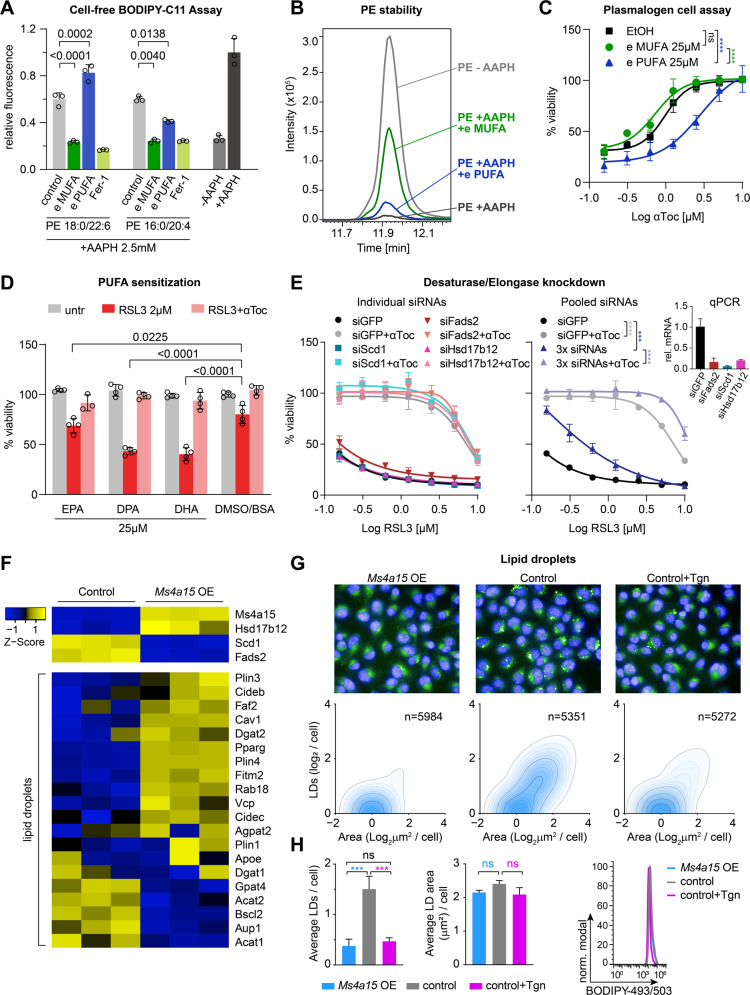
Fig. 5. Distinct activities of MUFA- and PUFA-containing plasmalogens and lipids.
A Antioxidant activity of plasmalogens (50 parts per million, ppm) “e MUFA” (P-18:0/18:1) PC or “e PUFA” (P-16:0/20:4) PE and 3 ppm ferrostatin-1 (Fer-1) on BODIPY-C11 oxidation in the presence of 50 ppm ester lipids (PE 18:0/22:6 and PE 16:0/20:4) in 2,2’-Azobis(2-amidinopropane) dihydrochloride (AAPH). Fer-1 is given as control. Significance was evaluated by two-tailed t-test. B Peak area stability (LC-MS²) of PUFA ester lipids (PE 16:0/20:4) in presence of plasmalogens in 2,2’-Azobis(2-amidinopropane) dihydrochloride (AAPH). C Cell viability of control cells incubated with 25 µM plasmalogens (e MUFA and e PUFA) or EtOH for 8 h then challenged with 0.3 µM RSL3 in the presence of αToc in a dose-dependent manner. D Viability of Ms4a15 OE cells pretreated with PUFAs eicosapentaenoic acid (C20:5, EPA), docasapentaenoic acid (C22:5, DPA), and doxosahexaenoic acid (C22:6, DHA) with ferroptosis induction by 2 μM RSL3 and αToc rescue. Significance was evaluated by two-tailed t-test. E RSL3 treatment of 72 h siRNA knockdown of Scd1, Fads2, or Hsd17b12 compared to siGFP in control cells as individual experiments (left panel) or all three siRNAs together (3x siRNA, right panel). Inset shows relative gene expression by qPCR (rel. mRNA). F Heatmap showing dysregulation of genes involved in lipid droplet formation. G BODIPY 493/503 staining of lipid droplets of Ms4a15 OE, control and 14 d Tgn-treated cells. High-content images (upper) showing lipid droplet dispersion. Quantification of lipid droplet number (LDs/cell) and area (μm2/cell) was performed by Harmony software (PerkinElmer). H Analysis of average lipid droplet number and area (left) and fluorescence intensity (right). Data were obtained from three independent experiments and a representative experiment shown with analysis by Harmony software. Lipid droplet intensity is depicted via a flow cytometry histogram of a representative experiment of three independent repetitions. Significance was evaluated by two-tailed t-test. Cell-free assay and viability assays are reported as mean ± SD of n = 3 (A, C, E) or n = 4 (D) technical replicates of three independent experiments with similar outcomes. Curve statistics, p-values of two-way ANOVA, shown above comparisons. *P < 0.05, **P < 0.01, ***P < 0.001, ****P < 0.0001.

