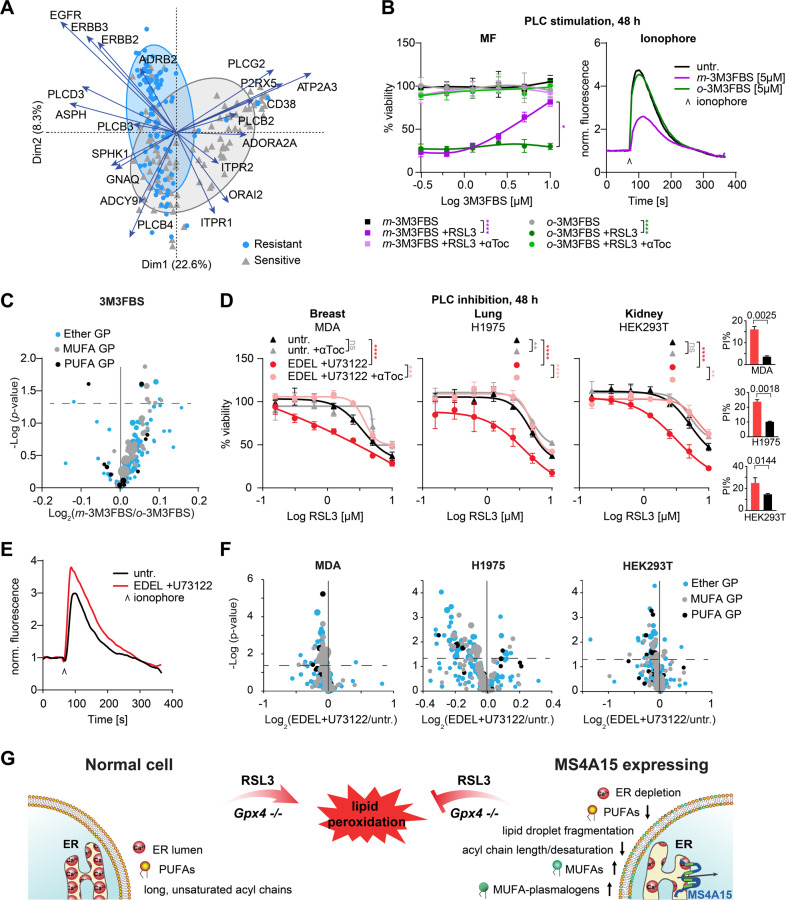
Fig. 6. Global Ca2+ genes define a signature for ferroptosis sensitivity.
A PCA biplot of mRNA gene expression of RSL3 resistant/sensitive cell lines. The distance between points approximates gene expression differences among groupings. Arrows indicate driver genes with greater biplot scores. Arrow length indicates relative abundance differences in associated samples. B Dose response curves of control cells against RSL3 (0.4 μM) after 48 h pretreatment with PLC activator m-3M3FBS and inactive analog o-3M3FBS. Addition of 10 μM αToc serves as rescue control. Ca2+ store depletion was detected by ionophore. C Volcano plot of lipid changes in 3M3FBS samples for Ms4a15 OE modulated species. Dot size indicates abundance of single lipid species. D–F Dose response curve of cell lines pretreated with PLC inhibitors (2 µM U73122 + 1.5 µM edelfosine, EDEL) for 48 h. RSL3 was applied for ferroptosis induction and αToc serves as rescue control. E Ca2+ store accumulation was detected by ionophore. F Volcano plot of lipid changes for treated versus untreated (untr.) cells for Ms4a15 OE modulated species. Dot size indicates single species abundance. G Schematic overview of MS4A15-mediated ferroptosis resistance. Overexpression of MS4A15 leads to ER Ca2+ store depletion, resulting in decreased PUFA- and long chain acyl-lipids. Simultaneously, increased MUFAs and MUFA-plasmalogens act as ROS sinks to protect cells from lipid peroxidation. Viability data are plotted as representative mean ± SD of n = 3 technical replicates for independent experiments repeated at least three times with similar outcomes. Curve statistics, p-values of two-way ANOVA, shown above comparisons. *P < 0.05, **P < 0.01, ***P < 0.001, ****P < 0.0001.

