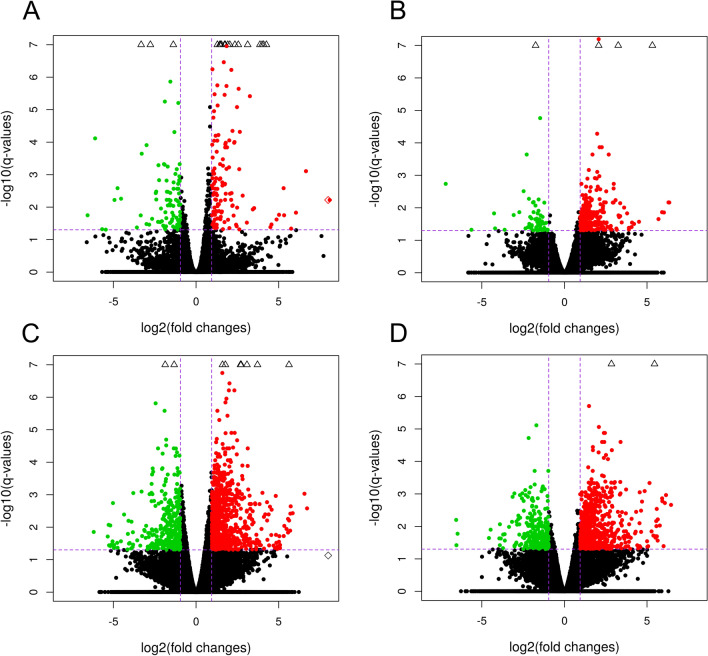
Figure 1.
Volcano plots describing the abundance of transcript expression profiles after LPS treatment (A); the impact of PPARγ agonists—PGJ2 (B) or pioglitazone (C) and antagonist (D) on LPS action in endometrial tissue. Logarithmic fold changes in expression (log2FC) are plotted on the X-axis against normalized adjusted p-values (Y-axis). The sharp horizontal line denotes the negative logarithmic adjusted p-value (0.05) cut-off. Sharp vertical lines denote the fold change cut-off (absolute value of log2FC > 1). Points represent gene expression values, where green (underexpressed) and red (overexpressed) points denote significant genes (adjusted p-value < 0.05). Grey dots indicate non-significant genes. The plots were generated in base and ggplot2 R bioconductor software.

