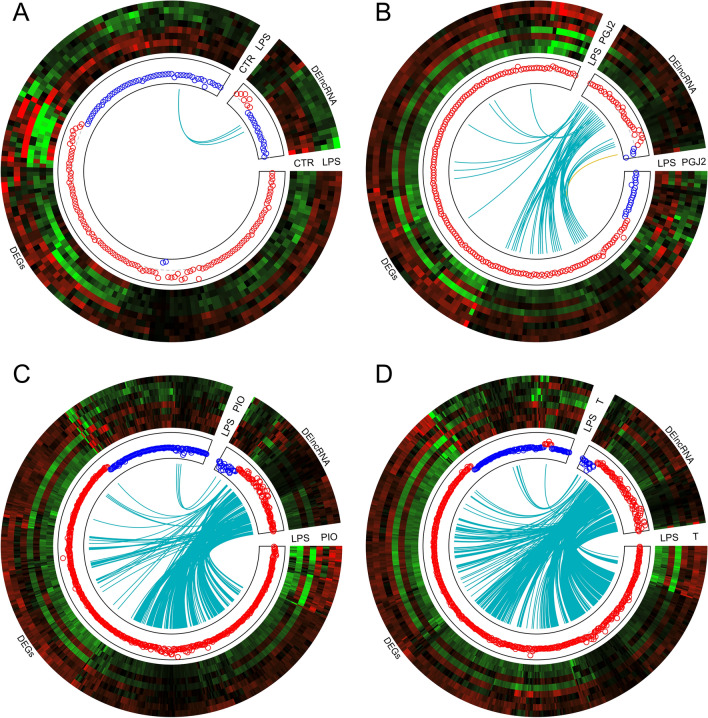
Figure 2.
Circular heatmaps presenting the associations between differentially expressed genes (DEGs) and differentially expressed long non-coding RNAs (DElncRNAs) in endometrial tissues treated with LPS (A), PPARγ agonists—PGJ2 (B) or pioglitazone (C) and antagonist (D). Each circle consists of eight upper tracks presenting the normalized (Z-score; red-green scale) expression profiles for DEGs and DElncRNAs in two separate blocks. The middle tracks describe the expression of upregulated (red) and downregulated (blue) genes in the each compared group. The innermost track presents the correlations between the co-expressed DEGs and DElncRNAs, where blue links depict positive correlations (> 0.9) and orange links depict negative Euclidean correlations (< − 0.9). The plots were generated in circlize R bioconductor software.

