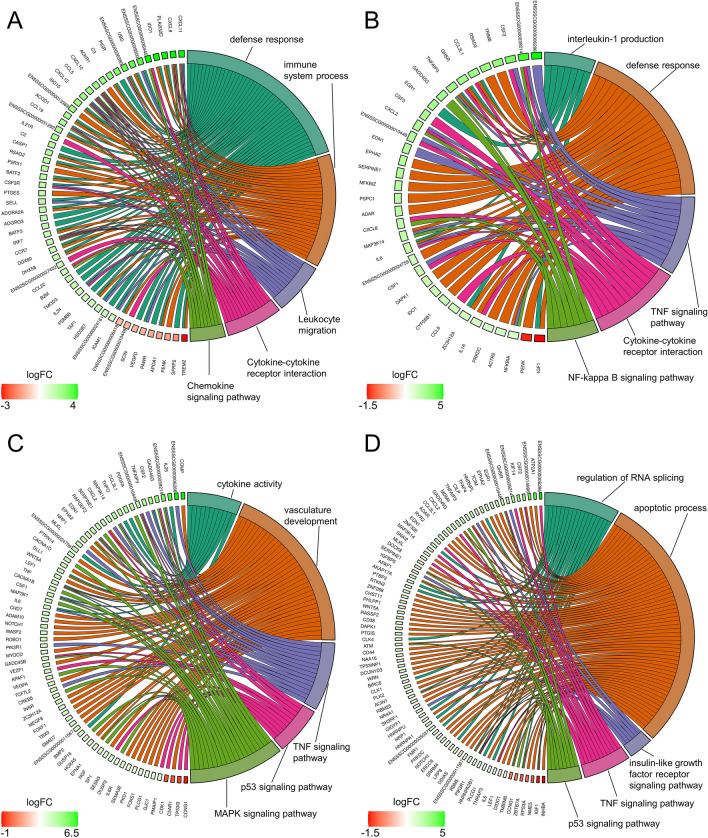
Figure 3.
Circos plots presenting selected Gene Ontology processes and KEGG pathways associated with differentially expressed genes (DEGs) engaged in the responses to LPS (A), PPARγ agonists PGJ2 (B) or pioglitazone (C) and antagonist (D) in endometrial tissue. Logarithmic values (blue-red scale) represent the fold change (logFC) of DEGs. Five-color links combine gene symbols (left) with the most important GO and KEGG annotations (right). The plots were generated in the GOplot R bioconductor software.

