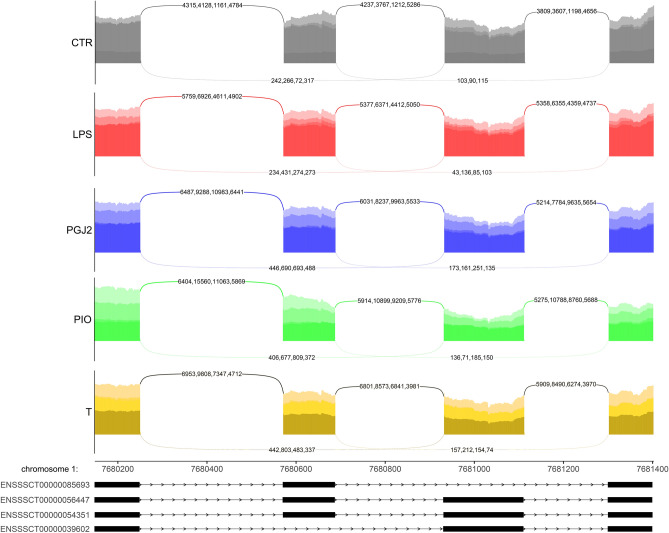
Figure 5.
Sashimi plot (quantitative visualization) of differential alternative splicing events (DASEs) in the SOD2 gene. Upper colored tracks represent the experimental conditions within mutually exclusive exons (MXEs). The numbers on curved lines indicate the number of counts for each splice junction. The middle track depicts the genomic coordinates of DASEs on the chromosome. The bottom tracks represent exons engaged in DASEs. The plot was generated in ggsashimi Python script.

