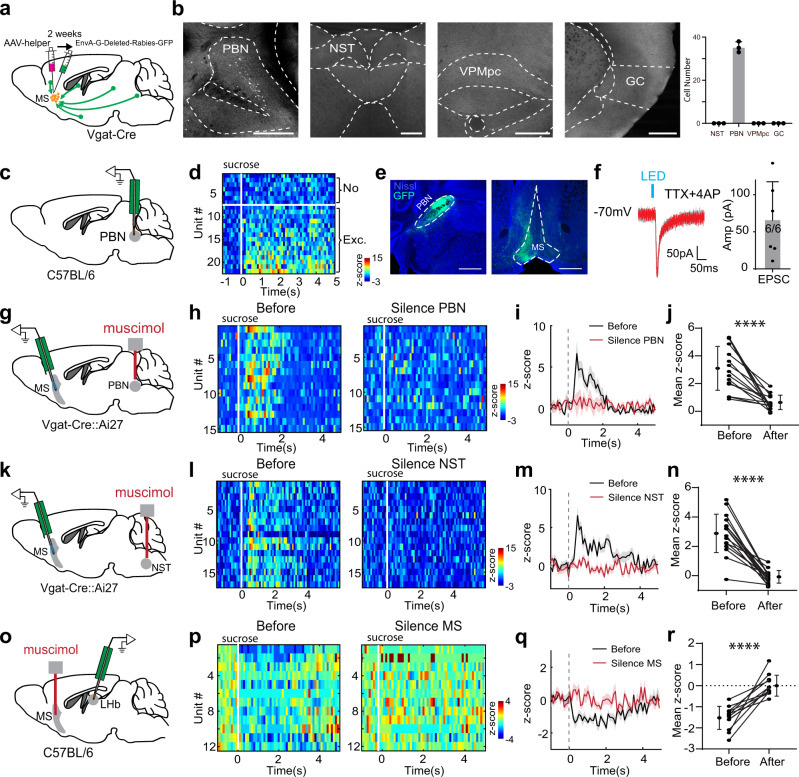
Fig. 3. A bottom-up sensory pathway to relay rewarding gustatory signals via MS.
a Injection strategy for the retrograde tracing of monosynaptic inputs to MS GABAergic neurons. b Retrogradely labeled neurons in PBN, but no labeling in NST, gustatory thalamus (VPMpc) or gustatory cortex (GC). Scale bar, 500 µm. Right, average number of labeled neurons in each area (n = 3 experiments). c Multichannel recording in PBN. d Heatmap plot of Z-score for PBN neuron responses to sucrose (n = 22 cells). 68% (15/22) of recorded neurons displayed a significant excitatory response to sucrose. e Labeling of PBN Vglut2+ neurons by injecting AAV-DIO-GFP in Vglut2-Cre mice (n = 3 experiments). Left, GFP expression at the injection site. Right, GFP-labeled PBN axons in MS. Scale bar, 500 µm. f Left, LED-evoked EPSCs recorded in an example MS neuron in the presence of TTX and 4AP. ChR2 was expressed in PBN Vglut2+ neurons. Gray, all recorded EPSCs. Red, average trace. Scale bar, 50 pA, 50 ms. Right, average EPSC amplitudes recorded in 6 MS neurons. All error bars in this figure indicate s.d. g Optrode recording from MS GABAergic neurons while pharmacologically silencing PBN bilaterally with muscimol. h Heatmap plot of Z-score for sucrose responses of MS GABAergic neurons before and after silencing PBN. i Population average. All shades indicate s.e.m. j Mean Z-score before and after silencing PBN (n = 15 cells). Data points for the same neuron are connected with a line. ****p < 0.0001, two-sided paired t test. k–n Similar to (g–j), but for silencing NST (n = 17 MS neurons). ****p < 0.0001, two-sided paired t test. o Recording from LHb neurons while pharmacologically silencing MS with muscimol. p Heatmap plot of Z-score for sucrose responses of LHb neurons before and after silencing MS. q Population average. r Mean Z-score before and after silencing MS (n = 12). ****p < 0.0001, two-sided paired t test. Source data are provided as a Source Data file.

