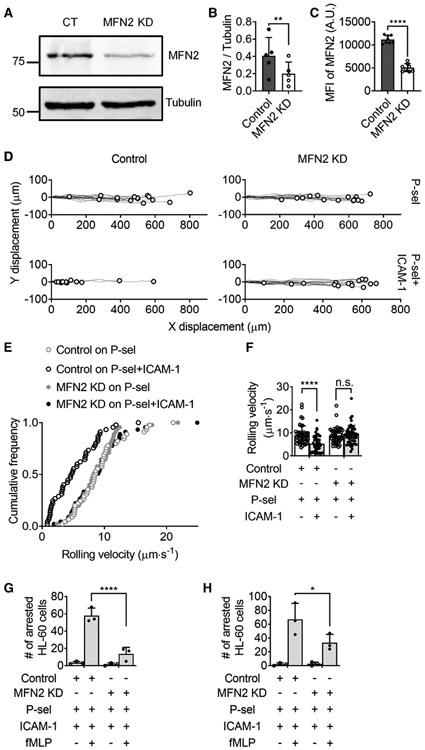
FIGURE 1. Mitofusin-2 knockdown reduces the adhesion of neutrophil-like HL60 cells.

(A) Western blot showing protein expression of mitofusin-2 (MFN2) in HL60 cells transfected with control (CT) or MFN2 knockdown (KD) with shRNA. Tubulin is an internal control. (B) Mean ± SD of MFN2 versus tubulin expression from n = 5 independent western blot experiments. (C) Mean ± SD of MFN2 expression from n = 8 independent intracellular staining flow cytometry experiments. (D) Tracks of Control or MFN2 KD HL60 cells rolling on a substrate of P-selectin or P-selectin/ICAM-1 under a wall shear stress of 6 dyn/cm2. The recording time of rolling was 60 s. The rolling paths (line) and ending positions (circle) of n = 15 cells from 3 individual experiments per group are shown. (E and F) A cumulative histogram (E) and a bar graph (F, mean ± SD, n = 45 cells from 3 individual experiments per group) showing the rolling velocity of CT or MFN2 KD HL60 cells rolling on the substrate of P-selectin with or without ICAM-1 under a wall shear stress of 6 dyn/cm2. (G and H) The number of arrested CT or MFN2 KD HL60 cells on the substrate of P-selectin/ICAM-1 with or without the stimulation of fMLP (100 nM) under a wall shear stress of 6 dyn/cm2 (G) and 2 dyn/cm2 (H). Mean ± SD, n = 3 individual records. n.s., non-significant (P > 0.05). *P < 0.05, ****P < 0.0001 by paired Student’s t-tests (B and C) or 2-way ANOVA followed by Tukey’s multiple comparisons tests (F and H). HL60 cells were pre-differentiated with 1.3% DMSO for 7 days
