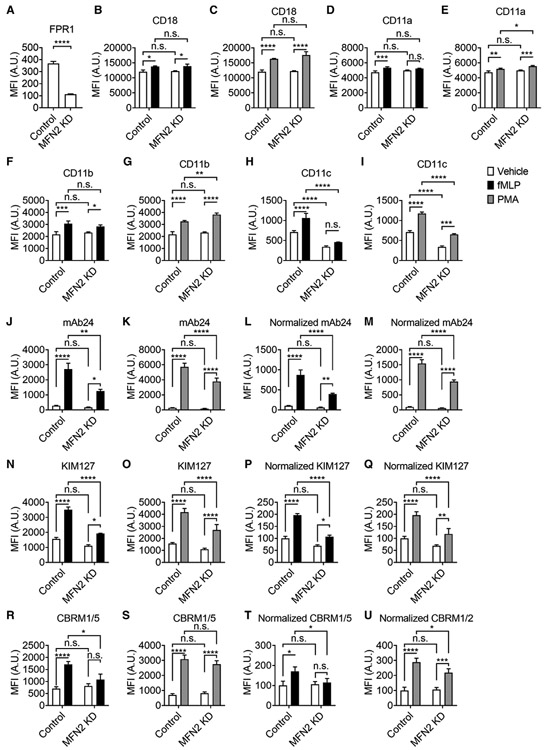
FIGURE 2. Mitofusin-2 knockdown reduces fMLP receptor expression as well as receptor-dependent and independent β2 integrin activation in neutrophil-like HL60 cells.

(A) Mean ± SD of surface FPR1 expression on Control or MFN2-knockdown (MFN2 KD) HL60 cells from n = 3 individual experiments. (B-I) Mean ± SD of overall surface CD18 (β2 integrins, B,C), CD11a (αL integrins, D,E), CD11b (αM integrins, F,G), CD11c (αX integrins, H,I) expression on Control or MFN2 KD HL60 cells stimulated with FPR1-dependent fMLP (100 nM, at RT for 20 min, closed bars, B, D, F, H), receptor-independent PMA (100 nM, at RT for 20 min, gray bars, C, E, G, I), or vehicle control (open bars) from n = 3 individual experiments. (J-U) Mean ± SD of high-affinity (H+, mAb24 staining, J-M) and extended (E+, KIM127 staining, N-Q) β2 integrin as well as H+ αM integrin (CBRM1/5 staining, R-U) expression on Control or MFN2 KD HL60 cells stimulated with FPR1-dependent fMLP (100 nM, at RT for 20 min, closed bars, J, L, N, P, R, T), receptor-independent PMA (100 nM, at RT for 20 min, gray bars, K, M, O, Q, S, U) or vehicle control (open bars) from n = 3 individual experiments. In L,M; P,Q; and T,U, the MFI of mAb24, KIM127, and CBRM1/5 is normalized to overall expression of CD18 (B,C), CD18 (B,C), and CD11b (F,G), respectively. n.s., non-significant (P > 0.05). *P < 0.05, **P < 0.01, ***P < 0.001, ****P < 0.0001 by Student’s t-test (A) or 2-way ANOVA followed by Tukey’s multiple comparisons test (B-U). HL60 cells were pre-differentiated with 1.3% DMSO for 7 days
