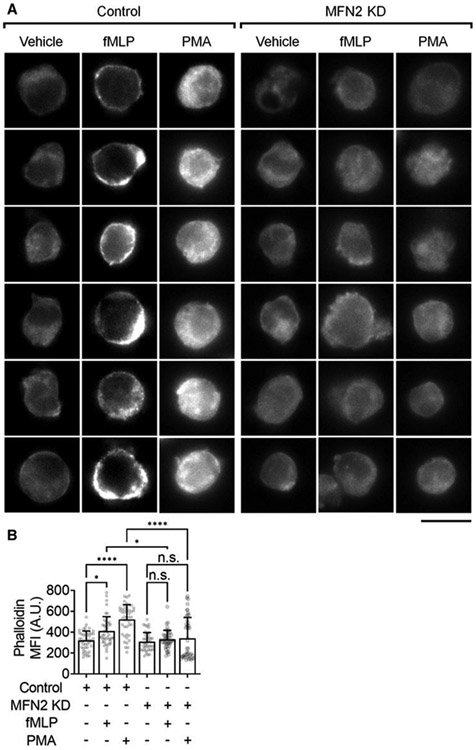
FIGURE 3. Mitofusin-2 knockdown eliminates actin polymerization in neutrophil-like HL60 cells after receptor-dependent and independent stimulation.

(A) Representative images of F-actin (phalloidin-AF568) in Control or MFN2-knockdown (MFN2 KD) HL60 cells stimulated with FPR1-dependent fMLP (100 nM, at RT for 20 min), receptor-independent PMA (100 nM, at RT for 20 min), or vehicle control. The scale bar is 10 μm. (B) Mean ± SD of phalloidin MFI quantified from n = 45 cells in 6 independent records per group. n.s., non-significant (P > 0.05) *P < 0.05, ****P < 0.0001 by 1-way ANOVA followed by Tukey’s multiple comparisons test. HL60 cells were pre-differentiated with 1.3% DMSO for 7 days
