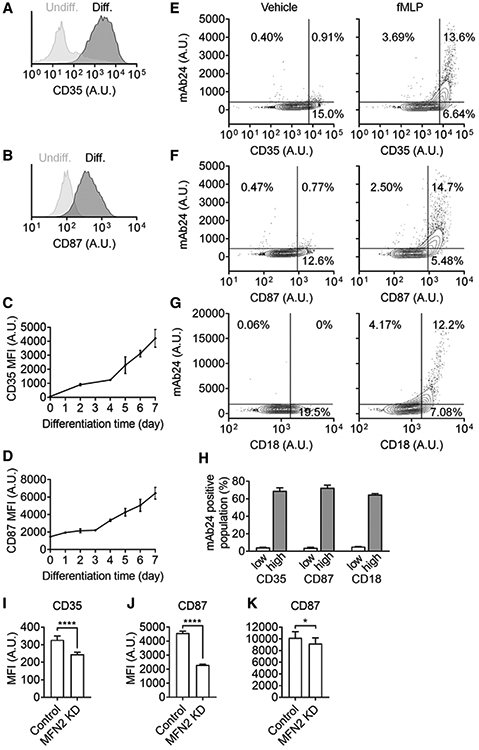
FIGURE 6. Mitofusin-2 knockdown impairs expression of β2-integrin-activation maturation markers during the DMSO-induced differentiation of HL60 cells.

(A,B) Representative histograms showing expression of CD35 (A) and CD87 (B) on HL60 cells pre-differentiated for 5 days (dark gray) or not (light gray). (C-D) Expression of CD35 (C), and CD87 (D) on HL-60 cells after different days of DSMO-induced differentiation. Mean ± 95%CI for n = 3 individual experiments. (E-H) Contour plots showing expression of high-affinity (H+, mAb24 staining) β2 integrins on pre-differentiated HL60 cells with different expression of CD35 (E), CD87 (F), and overall CD18 (G) stimulated with fMLP (100 nM, right panels) or vehicle control (left panels). (H) The percentage of mAb24+ cells in the low-expression or high-expression population of different markers upon fMLP stimulation. (I-K) Expression of CD35 (I) and CD87 (J-K) on Control or MFN2-knockdown (MFN2 KD) HL60 cells after pre-differentiated for 5 (I-J) or 7 (K) days. Mean ± SD for n = 3 (I) or 9 (J-K) individual experiments, *P < 0.05, ****P < 0.0001 by Student’s t-test
