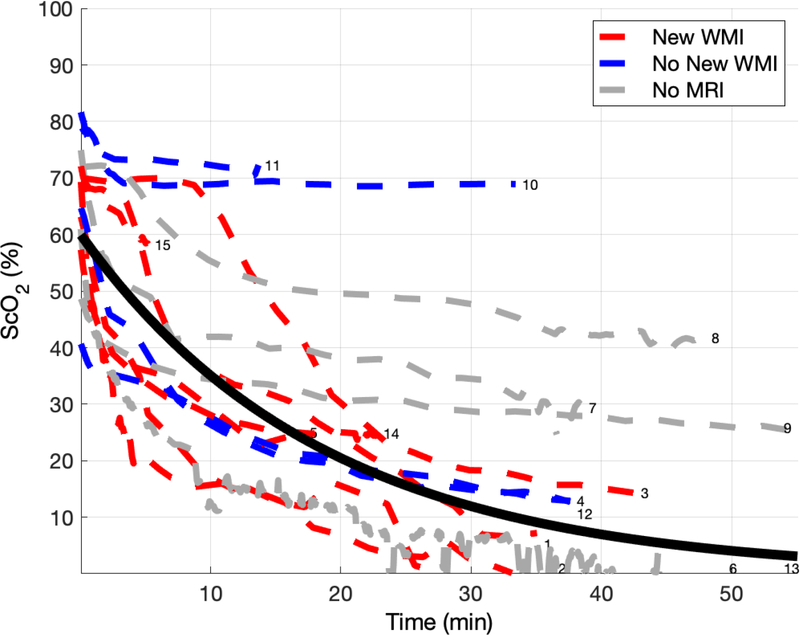
Figure 2.
Cerebral tissue oxygen saturation (ScO2) during deep hypothermic circulatory arrest (DHCA) for all 15 subjects. Time axis represents time on circulatory arrest. Each dotted line represents an individual subject. The color of each dotted line represents whether new postoperative white matter injury (WMI) was (red) or was not (blue) present, with a gray dotted line representing subjects for which a post-operative MRI was not performed (N=4). The solid black line is the line of best fit when fitting the data to an exponential decay. Curves are numbered with subject identifier (see Table 3).

