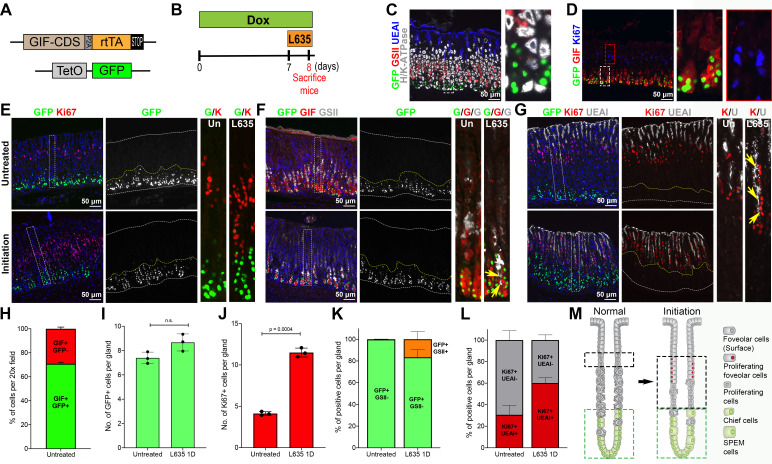
Figure 1.
Observation of GFP-positive chief cells during metaplasia initiation. (A) Diagram of the GIF-GFP allele used in this study. (B) Scheme of L635 treatment study in GIF-GFP mice. To first express GFP in chief cells, mice were administered doxycycline (Dox) water for 1 week before and throughout the L635 treatment. The GIF-GFP mice were treated with 1 dose of L635 following 1 week of Dox treatment to initiate the metaplastic process in the stomach mucosa. (C, D) Sections of the stomach tissues from GIF-GFP mice treated with Dox for 1 week were immunostained with antibodies against (C) GFP (green), GSII (mucus neck cells, red), UEAI (surface cells, blue) and H/K-ATPase (parietal cells, white) or (D) GFP (green), GIF (chief cells, red), Ki67 (proliferative cells/isthmal progenitor cells, blue). N=3 mice per group. (E–G) Sections of the stomach tissues from GIF-GFP mice treated without (untreated) or with 1 dose of L635 (initiation) at 1 week after the Dox treatment were immunostained with antibodies against (E) GFP (green) and Ki67 (red), (F) GFP (green), GIF (red) and GSII (white) or (G) GFP (green), Ki67 (red) and UEAI (white). Nuclei were counterstained with Hoechst (blue). Yellow arrows indicate cells copositive for GIF, GSII and GFP in panel F and cells copositive for UEAI and Ki67 in panel G. Dotted boxes depict regions enlarged. White dotted lines depict top and bottom of glands and yellow dotted lines depict the GFP+ cell zone. n=3 mice per group. (H) Quantitation of GIF and GFP copositive cells in GIF-GFP untreated mouse stomachs. The graph displays the percentage of GIF+/GFP+ (green) or GIF+/GFP− (red) cells per ×20 field. (I) Quantitation of GFP+ cells in GIF-GFP untreated or L635 1D mouse stomachs. The graph displays the number of GFP+ cells per gland. (J) Quantitation of K67+ cells in GIF-GFP untreated or L635 1D mouse stomachs. The graph displays the number of Ki67+ cells per gland. (K) Quantitation of GFP/GSII copositive cells in GIF-GFP untreated or L635 1D mouse stomachs. The graph displays the percentage of GFP+/GSII- (green) or GFP+/GSII+ cells (orange) per gland. (L) Quantitation of Ki67/UEAI copositive cells in GIF-GFP untreated or L635 1D mouse stomachs. The graph displays the percentage of Ki67+/UEAI+ (red) or of Ki67+/UEAI− cells (grey) per gland. Statistical significances were determined by unpaired Welch’s test (N=3 per group). (M) Schematic diagram of metaplasia initiation. Ggreen dotted lines depict the GFP+ chief cell zones and black dotted lines depict the proliferating cell zones in glands at the normal or metaplasia initiating stage. GIF, gastric intrinsic factor; n.s, not significant.

