Figure 3.
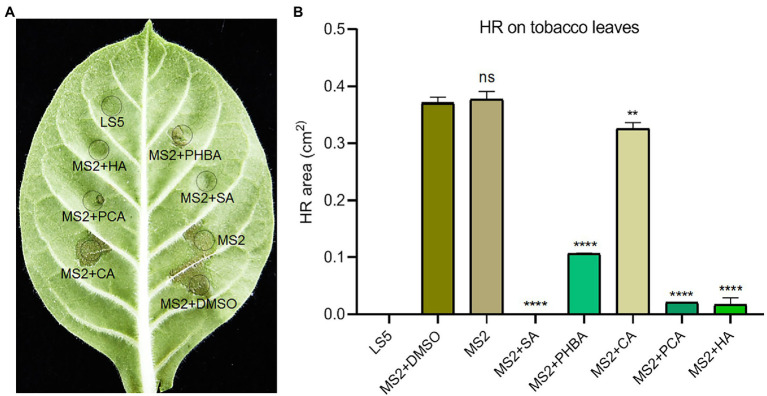
Effects of SA (0.15 mM), PHBA (0.4 mM), CA (0.2 mM), PCA (0.2 mM), and HA (0.5 mM) on the hypersensitive response (HR) induced by MS2 on tobacco leaves. (A) HR symptoms on Nicotiana tabacum K326 leaves. Cell suspensions of MS2 at OD600 of 0.6 were incubated in the dark with optimal concentrations of the tested compounds or DMSO for 4 h, then 100 μl of bacterial suspensions were press-infiltrated to tobacco leaves. HRs were photographed at 24 h. (B) The area of HR lesions. ImageJ software was used to measure the area of lesions. MS2 + DMSO was used as the positive control. The data were the mean of three replicates and subjected to Student’s t-test analysis by Graphpad Prism 8.4.3 (ns, no statistical significance, **p < 0.01, ****p < 0.0001).

