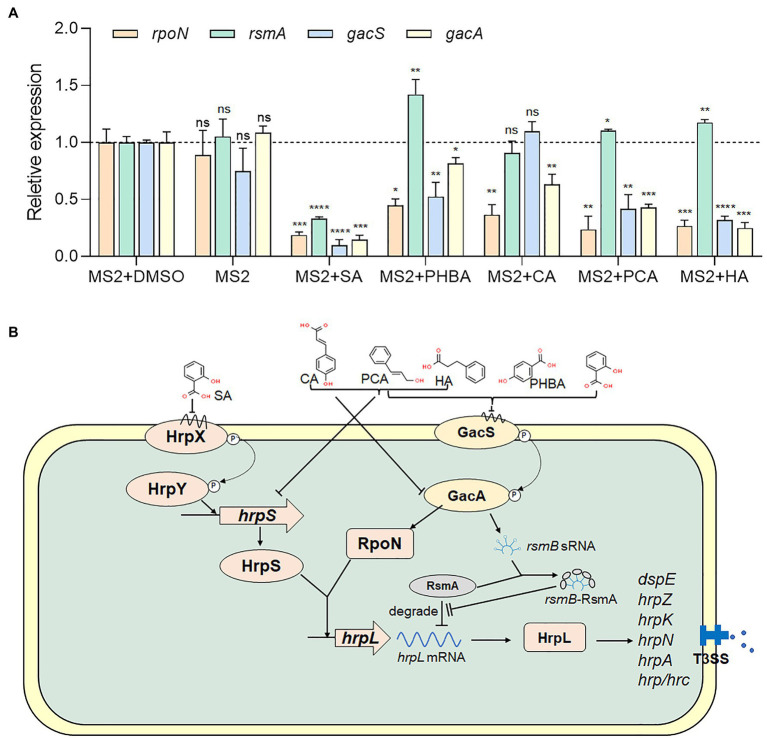
Figure 5.
Regulation of SA, PHBA, CA, PCA, and HA on T3SS. (A) Effects of SA (0.15 mM), PHBA (0.4 mM), CA (0.2 mM), PCA (0.2 mM), and HA (0.5 mM) on the expression of rpoN, rsmA, gacS, and gacA. RNA was collected at a bacterial concentration of OD600 of 0.8. The cDNA levels of different samples were quantified by RT-PCR using a SYBR Green Master Mix. A housekeeping gene atpD was used as an endogenous control for data analysis. All gene expression under compound treatment or no solvent (MS2) was compared with that of MS2 + DMSO using Student’s t-test analysis (Graphpad Prism 8.4.3). Three independent tests were performed with similar results (ns, no statistical significance, *p < 0.05, **p < 0.01, ***p < 0.001, and ****p < 0.0001). (B) Regulatory network controlling the Dickeya zeae T3SS. In Dickeya bacteria, the expression of T3SS is regulated by a master regulator, HrpL (Hu et al., 2022). On one hand, hrpL upregulates many hrp genes that encode the T3SS structural and functional proteins, such as hrpA, hrpN, and dspE (Hu et al., 2022). On the other hand, the expression of hrpL is regulated by the HrpX/HrpY-HrpS-HrpL pathway at the transcriptional level and the GacS-GacA-RsmB-RsmA pathway at the post-transcriptional level (Chatterjee et al., 2002; Yap et al., 2005; Yuan et al., 2020). ⊥, negative control; →, positive control.

