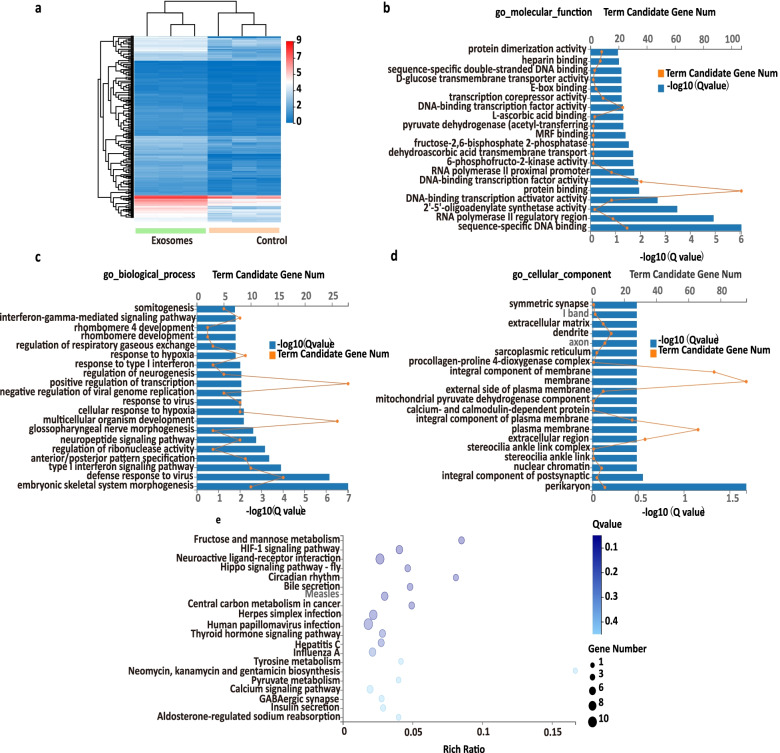
Fig. 5.
Transcriptome profiling of brain organoids exposed to breast cancer cell-derived exosomes. A Hierarchical clustering of unregulated DEGs in brain organoids treated with exosomes (the exosomes group) compared with the organoids without exosomes treatment (the control group). B Go enrichment of upregulated DEGs associated with molecular function in exosomes groups. C Go enrichment of upregulated DEGs associated with biological process in exosomes groups. D Go enrichment of upregulated DEGs related to cellular component in exosomes groups. E KEGG pathways of upregulated DEG in brain organoids exposed to exosomes. The x-axis and y-axis represent the rich ratio and the KEGG terms, respectively. The color and size of the circle indicates adjusted P-value and gene number, respectively

