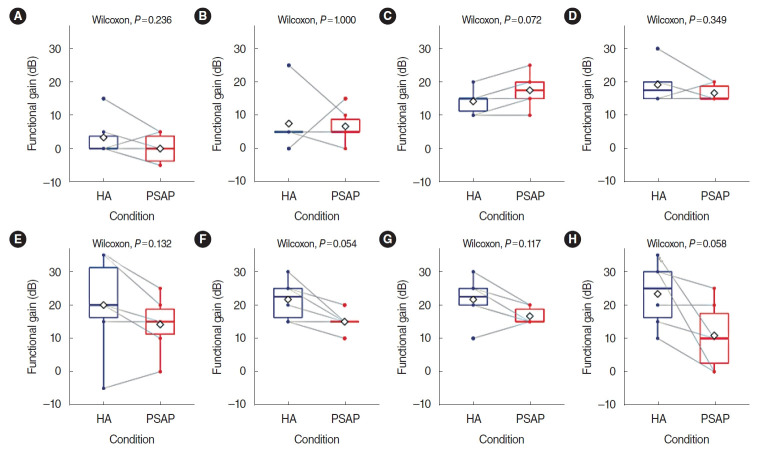
Fig. 2.
Functional gain of a hearing aid (HA) and a representative personal sound amplification product (RPSAP) for six participants by frequency: (A) 250 Hz, (B) 500 Hz, (C) 1,000 Hz, (D) 2,000 Hz, (E) 3,000 Hz, (F) 4,000 Hz, (G) 6,000 Hz, (H) 8,000 Hz. Functional gain was defined as the difference in dB HL between the aided and unaided thresholds. The overlapping dots and gray lines indicate individual changes. The rhombus shape indicates the mean values of the results.

