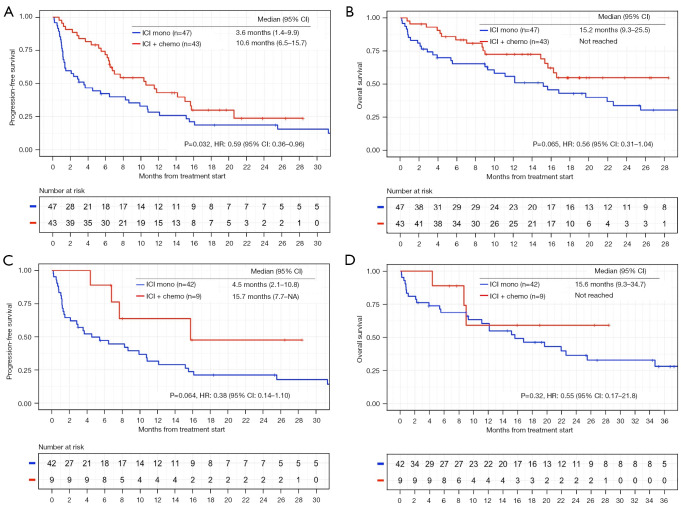
Figure 3.
Comparison of the Kaplan-Meier estimates of patients with max BTS ≥50 mm who received ICI-mono and ICI-chemo. (A) PFS (n=90). (B) OS (n=90). (C) PFS with PD-L1 score ≥50% group (n=51). (D) OS with PD-L1 score ≥50% group (n=51). BTS, baseline tumor size; max BTS, maximum BTS; ICI, immune checkpoint inhibitor; ICI-mono, ICI monotherapy; ICI-chemo, ICI in combination with chemotherapy; PFS, progression-free survival; OS, overall survival; PD-L1, programmed death ligand-1; HR, hazard ratio; CI, confidence interval.

