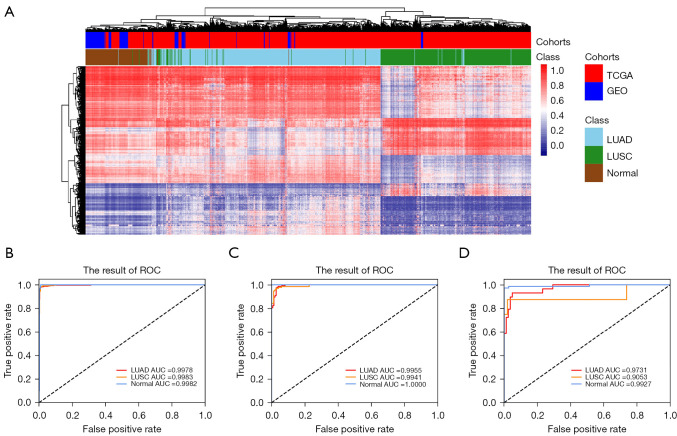
Figure 2.
Clustering and receiver operating characteristic analyses of the discovery and validation sets using the 5,426 CpG markers identified in TCGA cohort. (A) DNA methylation signatures can identify LUAD, LUSC, and NORMAL in TCGA and GEO cohorts. Shown are the unsupervised hierarchical clustering and heat maps associated with the methylation profile of 501 LUAD samples (sky-blue), 377 LUSC samples (green), and 148 normal samples (brown) in TCGA (red) and GEO (blue) cohorts with a panel of 5,426 CpG markers. Each column represents an individual patient, and each row represents an individual CpG marker. The color scale shows the DNA methylation level. (B) ROC curve of the diagnostic prediction model with methylation markers in 2/3 of the TCGA training cohort. (C) 1/3 of the TCGA validation cohort 1; (D) GEO validation cohort 2. LUAD, lung adenocarcinoma; LUSC, lung squamous cell carcinoma; TCGA, The Cancer Genome Atlas; GEO, Gene Expression Omnibus.

