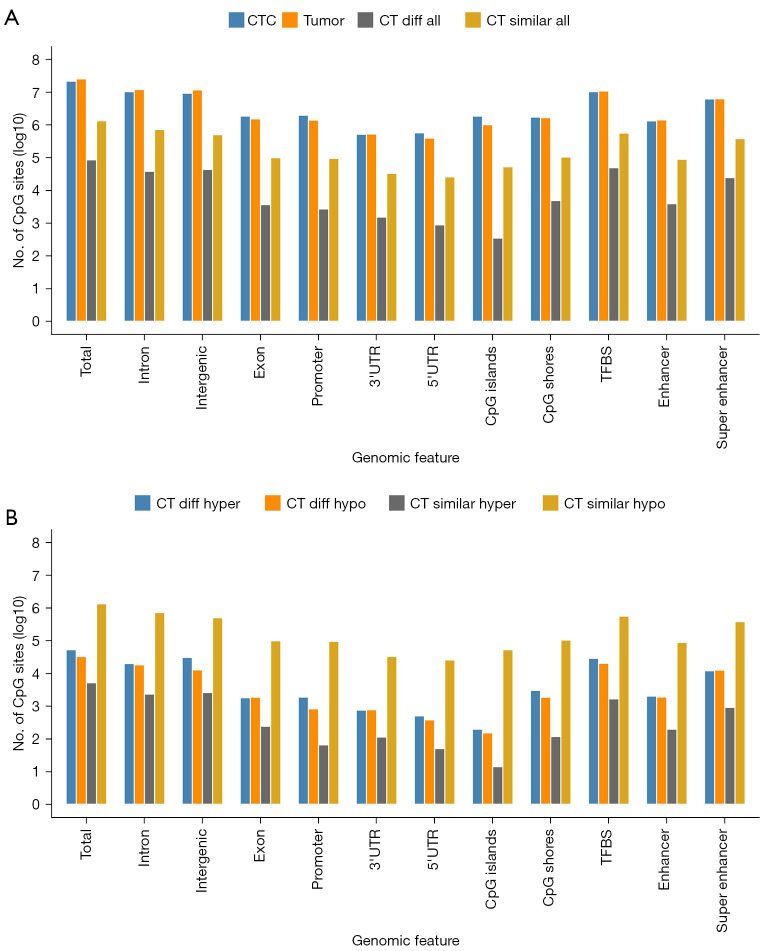
Figure 4.
CpG sites with known genomic features in 6 patients. CpG sites with no less than 3× coverage were counted, as shown in this figure. Similar CpG sites (CT similar) corresponding to genomic features with a normal P value >0.05 and a methylation difference <10% were counted between the CTCs and matched tumor tissues. Differential CpG sites (CT diff) corresponding to genomic features with a normal P value <0.05 and an absolute methylation difference >0.1 were counted in the CTCs compared to matched tumor tissues. The DMCs that appeared in 2 of the 6 patients are illustrated in this figure. CTC, circulating tumor cell.

