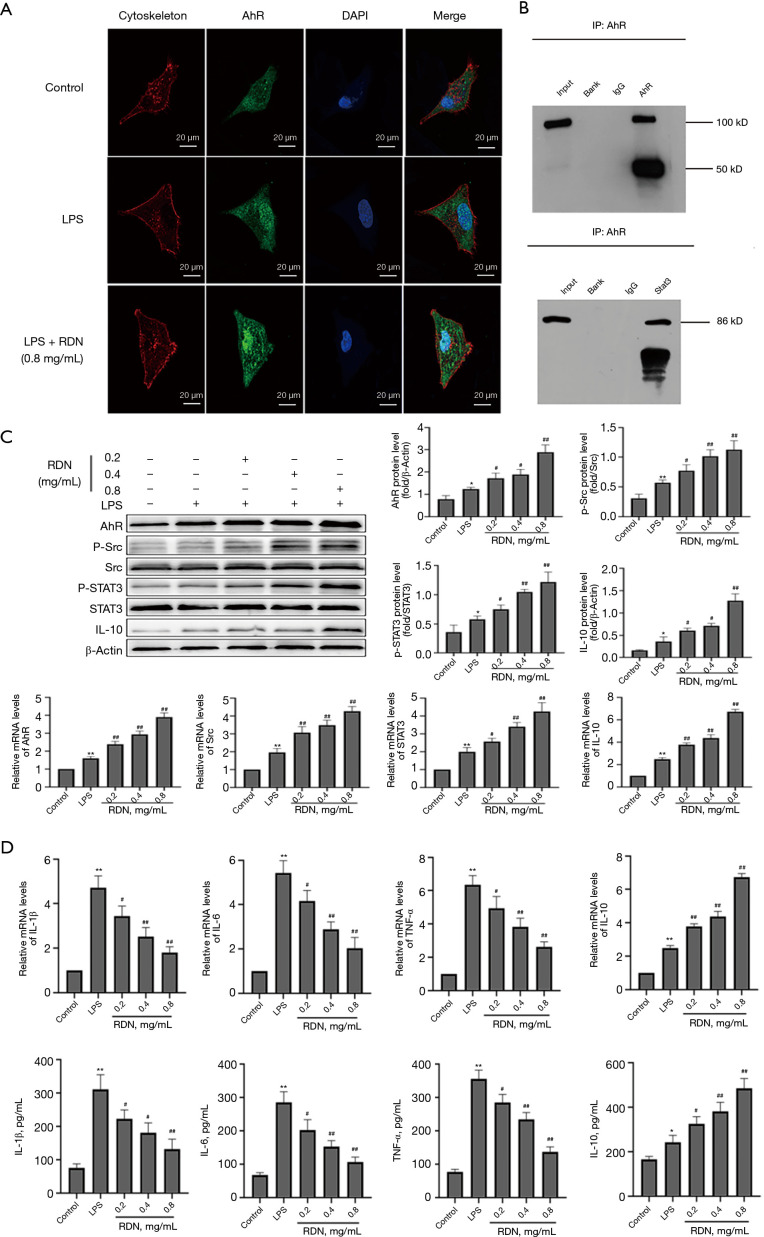
Figure 2.
RDN activates the Src-STAT3-IL-10 pathway through AhR. (A) Immunofluorescence staining shows the expression of AhR (green) in A549 cells (×630). (B) The interaction between AhR and STAT3 as determined by co-IP. (C) Western blots showing AhR, p-Src, Src, p-STAT3, STAT3, IL-10, and β-actin expression, and qRT-PCR assay results showing AhR, Src, STAT3, and IL-10 expression in A549 cells. (D) qRT-PCR assay results showing IL-1β, IL-6, TNF-α, and IL-10 expression in A549 cells, and ELISA results showing IL-1β, IL-6, TNF-α, and IL-10 concentrations in the cell supernatant. The values represent the mean ± SD of 3 independent experiments, and the differences between the mean values were assessed by the Student’s t-test. *, P<0.05, **, P<0.01 vs. the control group; #, P<0.05, ##, P<0.01 vs. the LPS group. RDN, Reduning; AhR, Aryl hydrocarbon receptor; p-Src, Phosphorylation Src tyrosine kinase; Src, Src tyrosine kinase; p-STAT3, Phosphorylation signal transducer and activator of transcription 3; STAT3, signal transducer and activator of transcription 3; IL-10, interleukin 10.

