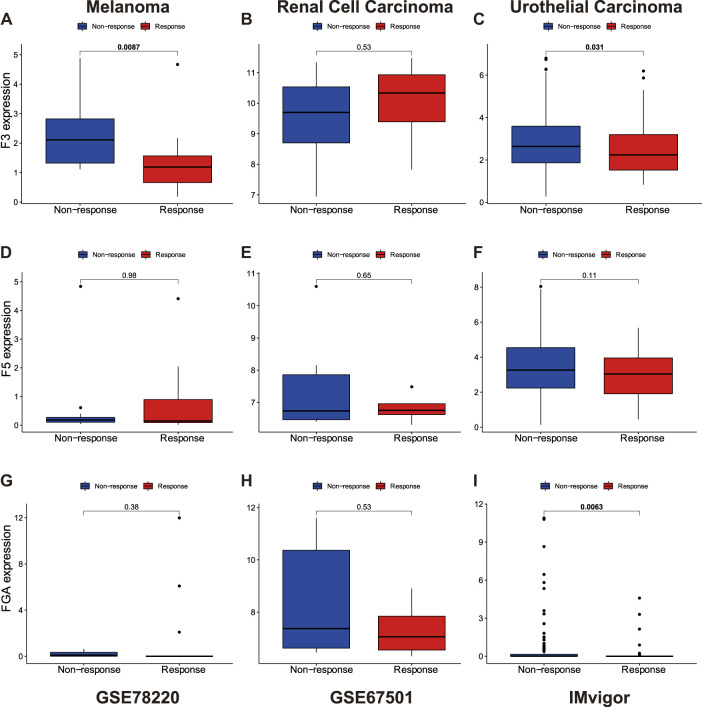
FIGURE 3.
Responses of anti-PD1/PDL1 therapy are affect by D-dimer related genes expression. (A–C) The relationship between F3 expression and responsiveness of anti-PD1/PDL1 therapy in melanoma, renal cell carcinoma and urothelial carcinoma. (D–F) The relationship between F5 expression and responsiveness of anti-PD1/PDL1 therapy, similar with F3. (G–I) The relationship between FGA expression and responsiveness of anti-PD1/PDL1 therapy, similar with F3.

