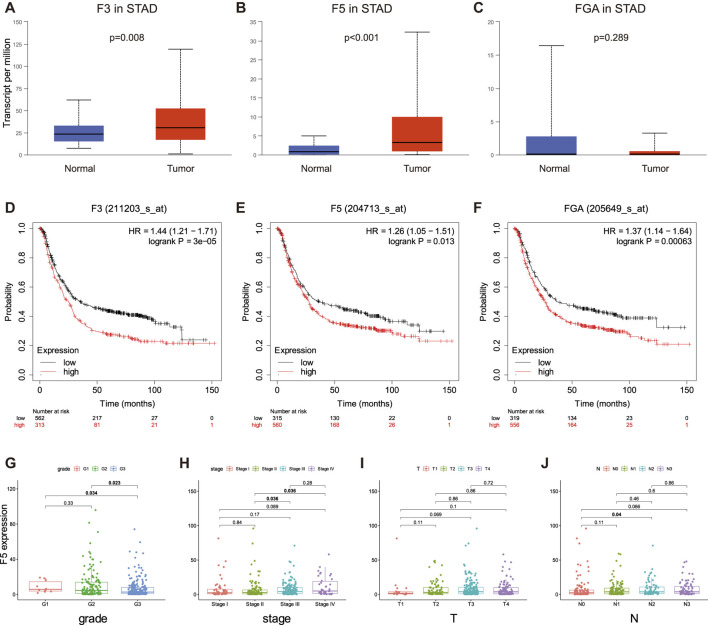
FIGURE 5.
Survival correlation, differential expression and clinicopathological relations in D-dimer-related genes. (A–C) Expression levels of F3, F5 and FGA between GC and normal samples using UALCAN. (D–F) Kaplan-Meier plots of the three D-dimer-related genes in GC using KM plotter. (G–J) Relationship between F5 expression and clinicopathological parameters.

