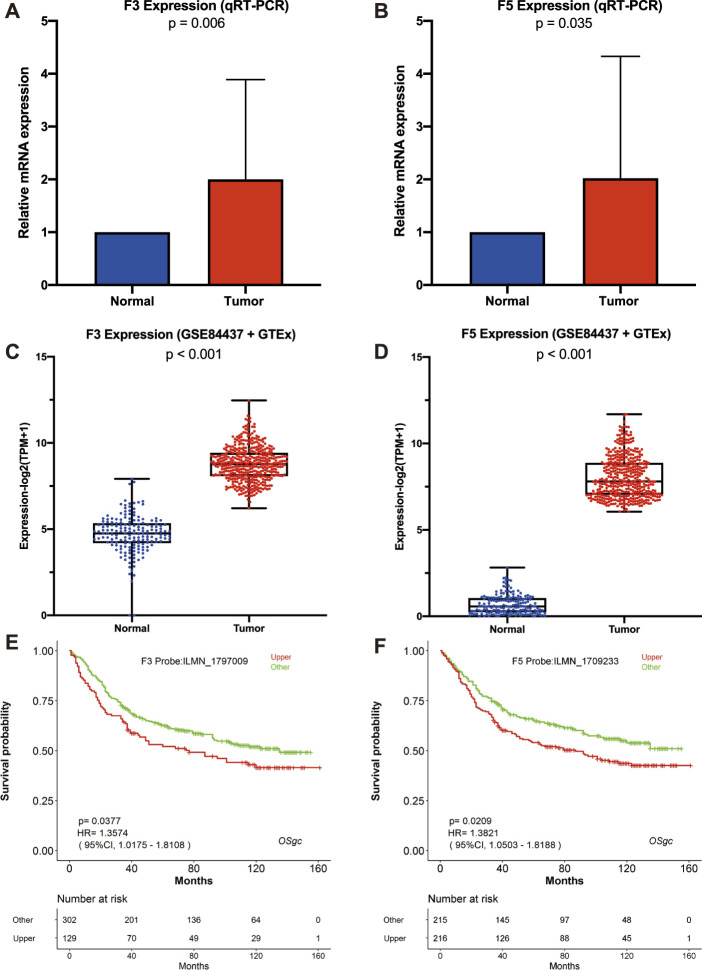
FIGURE 6.
Validation of F3 and F5’s biomarker potential via qRT-PCR and GEO cohort. (A–B) F3 and F5 expression compared within normal and tumor tissues via qRT-PCR. (C–D) Comparison of F3 and F5 expression via GEO-GSE84437 and GTEx data. (E–F) Kaplan-Meier plots of F3 and F5 using GSE84437 data, generated via LOGpc.

